Over the past few years, Bitcoin’s popularity has taken flight, with the cryptocurrency a well-known asset in the financial industry today. While it has become fairly common to talk about Bitcoin, fundamentally, it remains dissimilar to any other asset class.
One factor that completely distinguishes Bitcoin from other asset classes is its supply distribution that is configured within its code.
It must be noted, however, that while its algorithmic supply mechanism has been vital recently, it wasn’t perfect at the start.
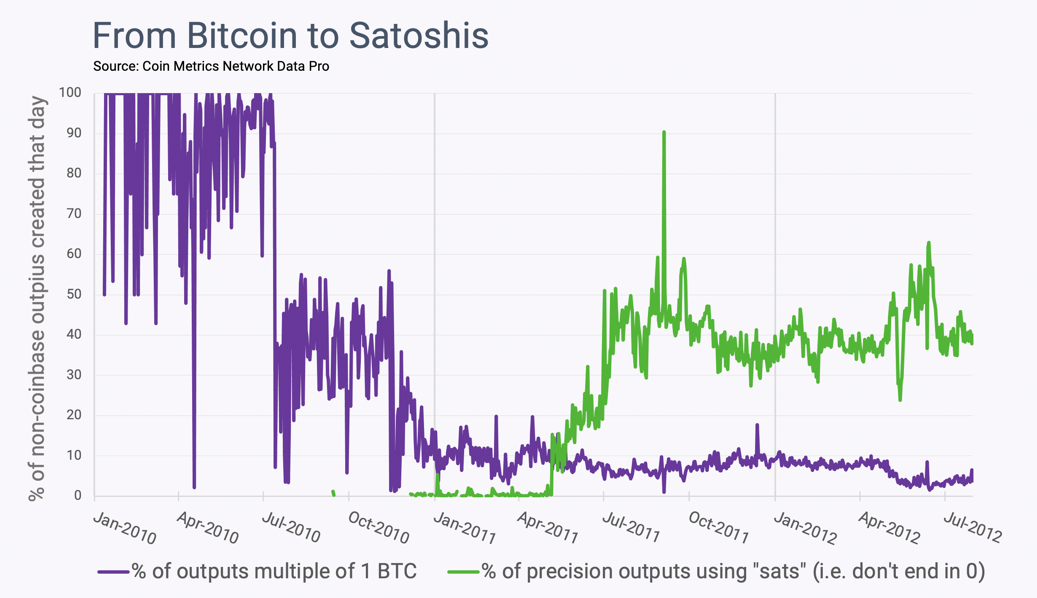
The transition from Bitcoin to Satoshis

Source: CoinMetrics
According to a recent CoinMetrics report, the early experiment of fair distribution with Bitcoin was ‘disastrous’ as transactions were settled as whole units of BTC. While the attached chart illustrates the transition of BTC to Sats (i.e Bitcoin to Satoshis), it should be noted that early wealth distribution left permanent damage since a lot of BTCs were lost. However, it was merely the beginning of a major change and BTC set the absolute precedent for digital asset convertibility.
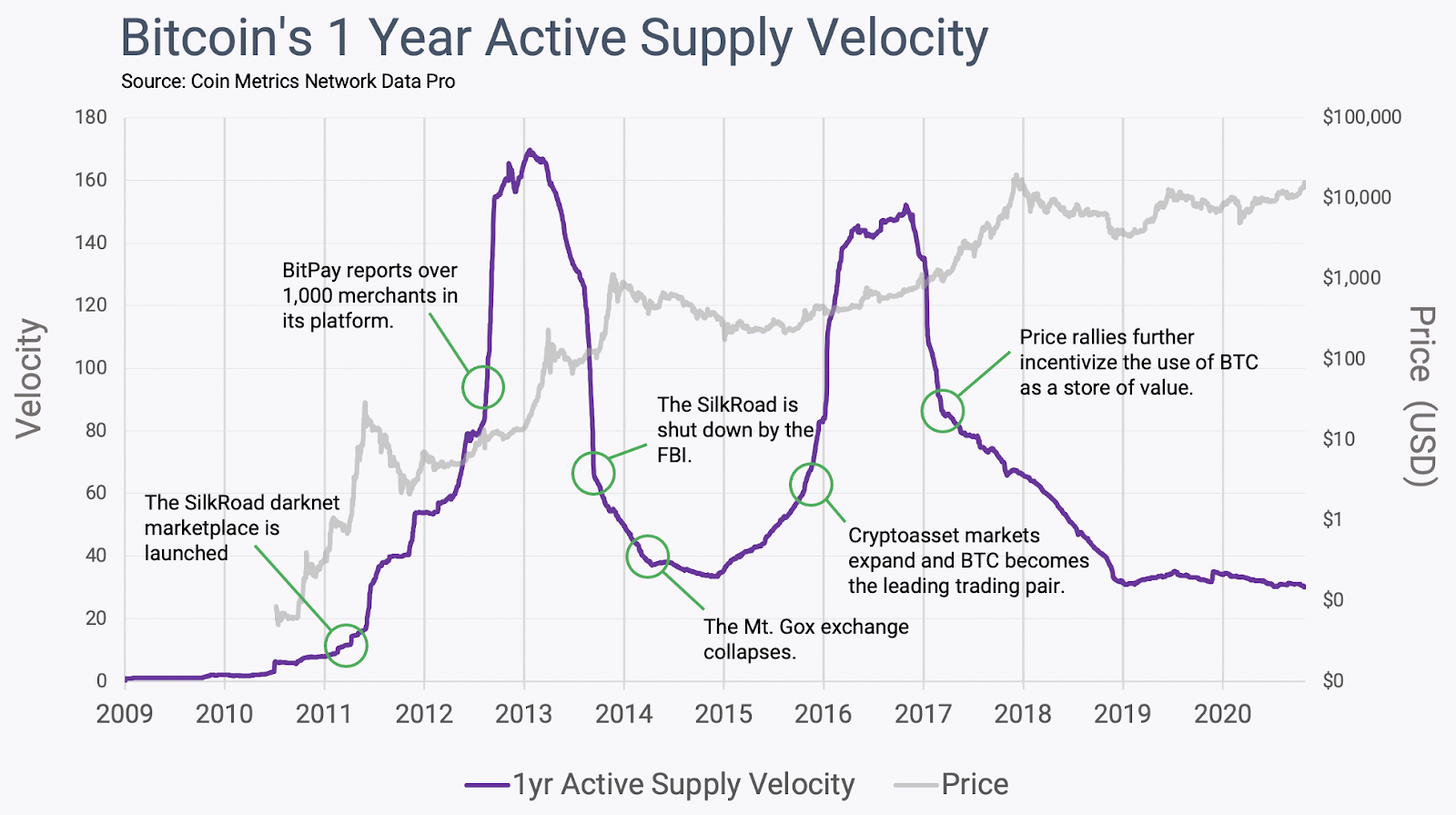
Now, because Bitcoin carried a high level of volatility, its active supply velocity was all over the place over a majority of the previous decade.

Source: Coinmetrics
Velocity measures the number of times an average unit of supply undergoes a transaction. Bitcoin’s velocity graph suggested that there was immense unmatched distribution, one wherein high supply turnover would wreck its price cycle. These were the early days of adoption when BTC would undergo staggering bullish rallies which would lead to further wealth distribution.
However, with more people getting their hands on Bitcoin, the larger financial space has started to take notice and FUD has risen. This is where the importance of halving cycles comes into the picture.
Miners, Supply Reduction, and drop in BTC Inflation rate
While people had known about the economics behind Bitcoin’s halving cycles, it only became more evident when supply turnover started to increase. The cost of attacking Bitcoin went up as the mining industry in Bitcoin began to rise. With more miners progressing and expanding in the space, more BTC changed hands and unmatched distribution started to disperse.
Now, CoinMetrics reported on a couple of new metrics that further validated Bitcoin’s case as an emerging distributed asset.
Supply Equality Ratio (SER) and Network Distribution Factor (NDF)
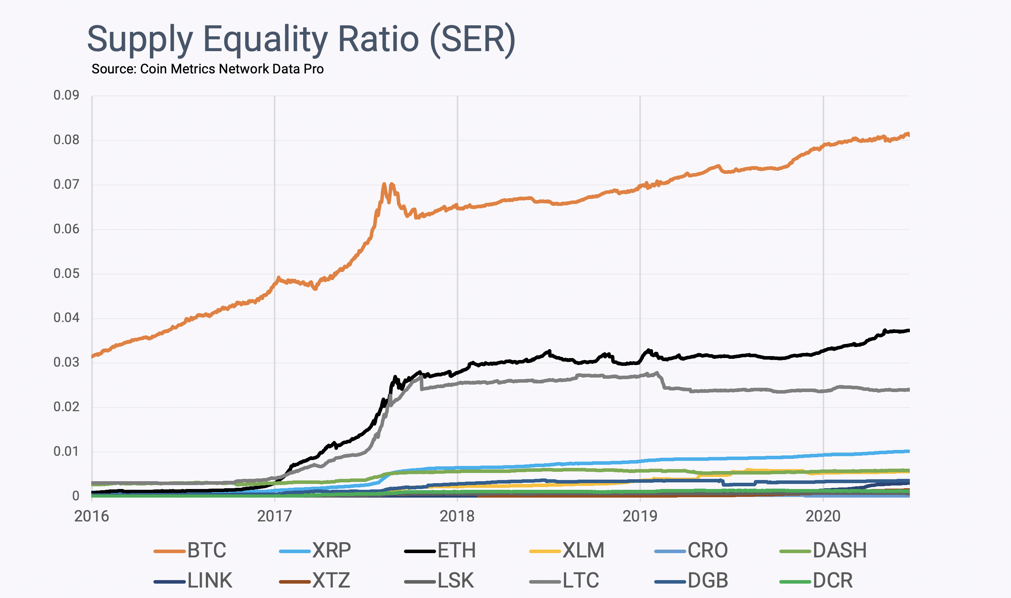

Without diving into details, a brief explanation for SER is that it compares the average income of the richest 20% BTC wallets to the poorest 20%. Now, the attached chart suggested that Bitcoin continued to outperform the likes of Ethereum and Litecoin, which is commendable in light of the fact that institutional accumulation pushes down on the SE Ratio.
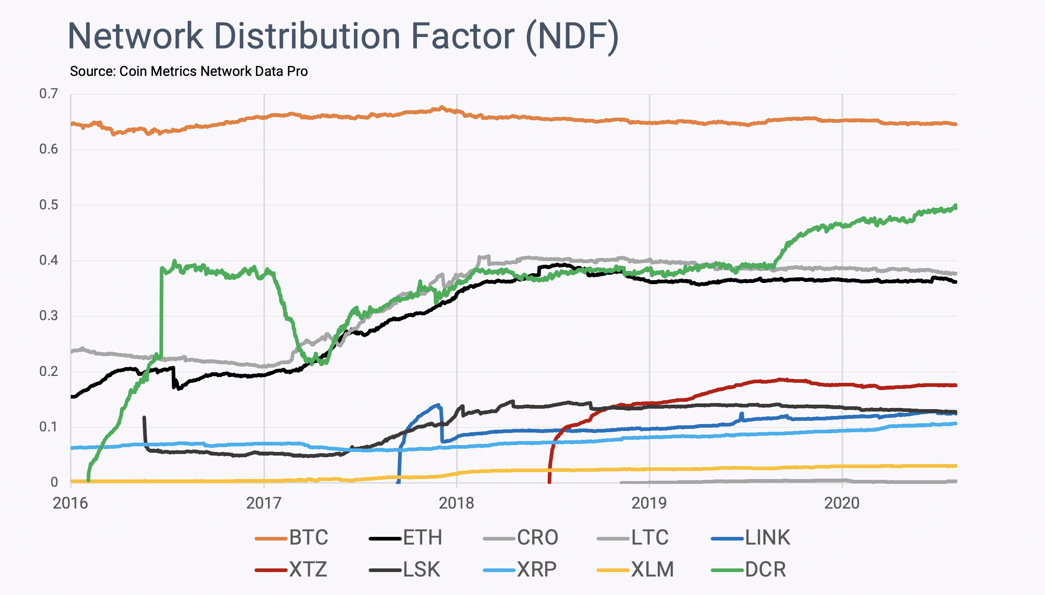
Here, the NDF factors in a broader economic group in Bitcoin, wherein the aggregate supply in addresses holding more than 0.01% of BTC’s supply is divided by the total supply.

Source: Coinmetrics
Bitcoin had the highest distribution factor here as well, beating the likes of Decred, Litecoin, and Ether.
Has Bitcoin reached supply distribution euphoria?
The asset has definitely come a long way. From unequal distribution between a few to a wider supply distribution with respect to its design, Bitcoin’s fundamental properties are finally unveiling themselves. However, the development is still at a grassroots level. While Bitcoin is possibly the most equitable crypto-asset under current conditions, its design only allows its supply distribution to improve over time.
The post appeared first on AMBCrypto


