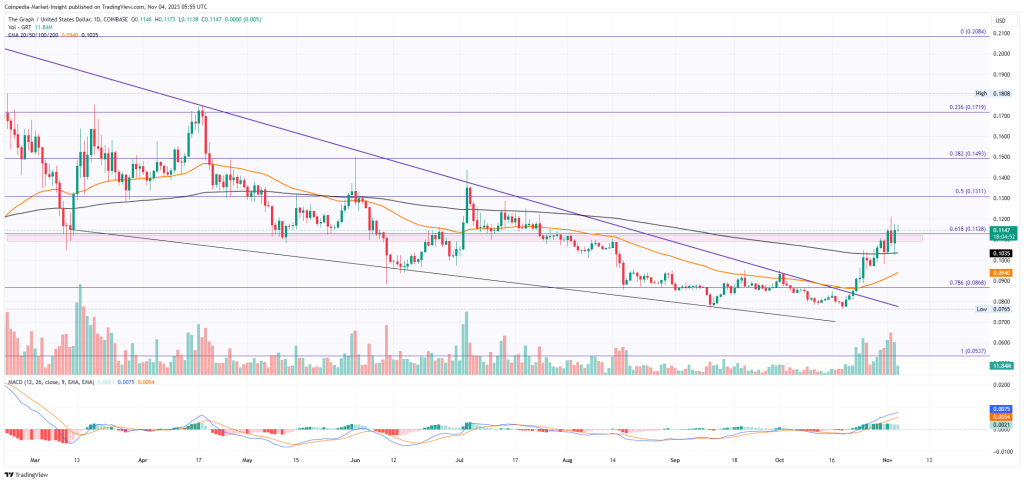
Concluding a 66% pullback, the GRT price trend showcases a bullish reversal to restart the prevailing uptrend seen in early 2023. With a double bottom reversal from $0.076, the graph coin price gives the falling wedge breakout and reclaims crucial average lines.
Further, with the altcoin price rising above the psychological mark, $0.10 increases the likelihood of a prolonged uptrend.

Rising with the high-speed breakout rally, the GRT price finds a spike in trading volume, supporting the bullish journey. Moreover, with the market-wide fueling the increased demand, the Graph coin price exceeds the 200-day EMA.
Moreover, the 200-day EMA breakout rally overcomes the supply pressure at the 61.80% Fibonacci level. With a diagonally uptrend move and increased volumes, the GRT price skyrockets and continues to reach the 50% Fibonacci level.
Currently trading at $0.1159 with an intraday growth of 1.22%, the altcoin price shows a bullish continuation above $0.1128. Moreover, the lower price rejection in the recent 5.62% jump overnight signals a strong demand at lower levels.
Technical Indicators:
EMA: The bullish trend continuation in the 50-day EMA showcases a high possibility of a golden crossover in the GRT price chart.
MACD indicator: The MACD and signal lines are moving close as the bullish gap declines, teasing a crossover event. However, a bullish trend above $0.1128 teases a positive recovery in the momentum indicator.
Will The GRT Price Skyrocket to $0.15?
As the market recovery takes a pause, the altcoin recovery is driving low on fuel and may struggle continuation if the broader market collapses. Nevertheless, the trend reversal in GRT price hints at a bull run to the $0.15 mark, close to the 38.20% Fibonacci level. However, a resistance at the 50% Fibonacci level at $0.1311 is possible.
On the flip side, a reversal under $0.1128 can plunge the market value to the $0.10 mark.
The post appeared first on Coinpedia


