Bitcoin’s on-chain fundamentals grew stronger post its second halving in 2016. However, while most traders have historically been focused on the world’s largest cryptocurrency’s price action, there is a degree of ignorance when it comes to studying metrics for building a trading strategy. Here are just a few of them that highlight such growth in Bitcoin’s fundamentals,
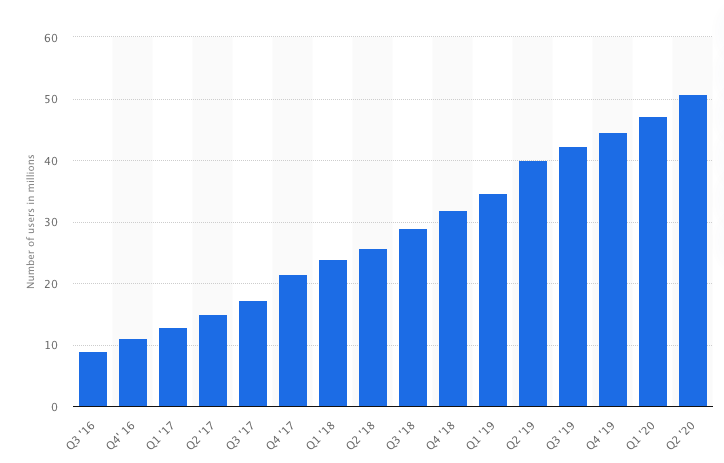
466% rise in the number of blockchain wallets since Q3 2016
There has been a hike in new buyers and active traders in the cryptocurrency. Retail buying has fueled rising demand at a steady pace, while also absorbing the liquidity from crypto-crypto exchanges.


Source: Statista
The same can be highlighted by the fact that the number of blockchain addresses has been at an all-time high this quarter, with the number even higher than the figures during the historic bull run of 2017-18. This rise in the number of wallets and increasing trading volume on spot exchanges has dropped the barrier for the entry of new traders.
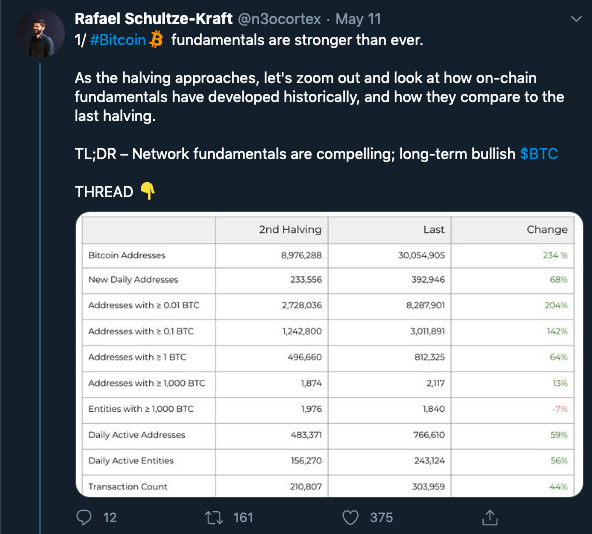
In addition to the number of wallets, an important metric is the number of wallets holding greater than 1 BTC. The number of wallets holding greater than 1 BTC has increased by 64% since 2016.
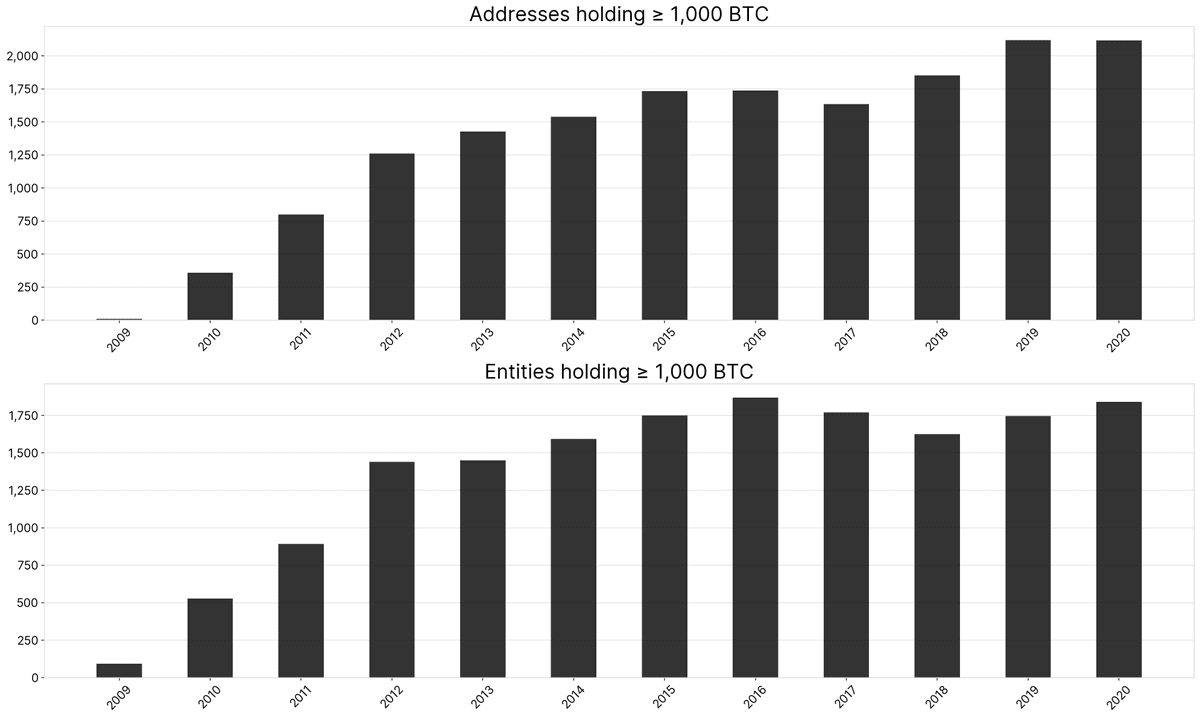
Addresses holding >1000 BTC have gone up, number of entities holding >1000 BTC not quite
Interestingly, entities holding 1000 BTC or more have dropped by 7%. However, one important point to consider here is that it has become more expensive to hold 1000 BTC. BTC’s price has risen by 1539% since 2016. Further, it’s worth noting that the number of addresses holding such quantities has hiked by 13%.
For day traders now, liquidity is greater than it was in 2016 and the spread on spot exchanges is much smaller.
Traders – In for the long run?
Bitcoin’s correlation with gold has increased post the third halving. Additionally, its inverse correlation with USD has risen. Bitcoin’s digital gold narrative has become more relevant now than ever before.
Based on this Chainalysis report, only 19% of the total circulating supply is actively traded throughout the world, while the rest is being held long-term by investors. Nearly 18.6 million Bitcoin were mined as of June 2020. 60% of it was held by entities that have never sold more than 25% of the Bitcoin they’ve received. The report in question labeled this as “held for long-term investment.”
Another 20% of the existing Bitcoin supply has not moved from its current set of addresses in five years. According to some, they may be labeled lost. However, the remainder – 3.5 million of all mined Bitcoin – is currently being used for trading on spot exchanges.
For traders, this implies that HODLing for long periods of time is not a bad idea, especially following the prominence of such a narrative.
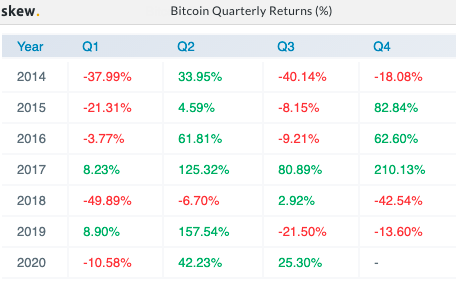
Bitcoin’s steady momentum is no 2016


Source: Skew
In 2016, Bitcoin’s quarterly returns were high for some quarters while they were negative for some others. This continued in 2017-18, with the period being witness to a historic bull run and the massive price drop in 2018. However, in Q1, Q2, and Q3 of 2020, the returns remained steady. For a trader, this signaled the maturity of a crypto-asset, while underlining expectations for quarterly returns.
In a tweet a few months ago, Rafael Schultze, CTO at Glassnode, had also commented on Bitcoin’s improving fundamentals. Pre-halving, he called out traders to examine the changes in the Bitcoin network and its prices with a bird’s eye view. With Bitcoin holding steady under $12,000 at the time of writing, it is a good time to heed his advice.


Source: Twitter
For day traders, despite small hiccups in price this quarter, the long-term sentiment remains mostly bullish. In fact, with no dramatic price rise and no spiraling drops, the last few months have been steady and consistent for the market’s active traders. With the rest of 2020 expected to have more of the same, opportunities to take profits are aplenty, enough to keep traders on their toes.
The post appeared first on AMBCrypto


