Having witnessed positive price fluctuations on the daily charts for top digital assets Bitcoin and Ethereum, the rest of the cryptocurrency market appeared to be heading for a bullish revival.
With some bullishness witnessed on its hourly chart, Litecoin could be seen targeting its overhead resistance soon. While the possibility of a stalled bearish drag finally seemed likely for Compound and FTX Token.
Litecoin [LTC]
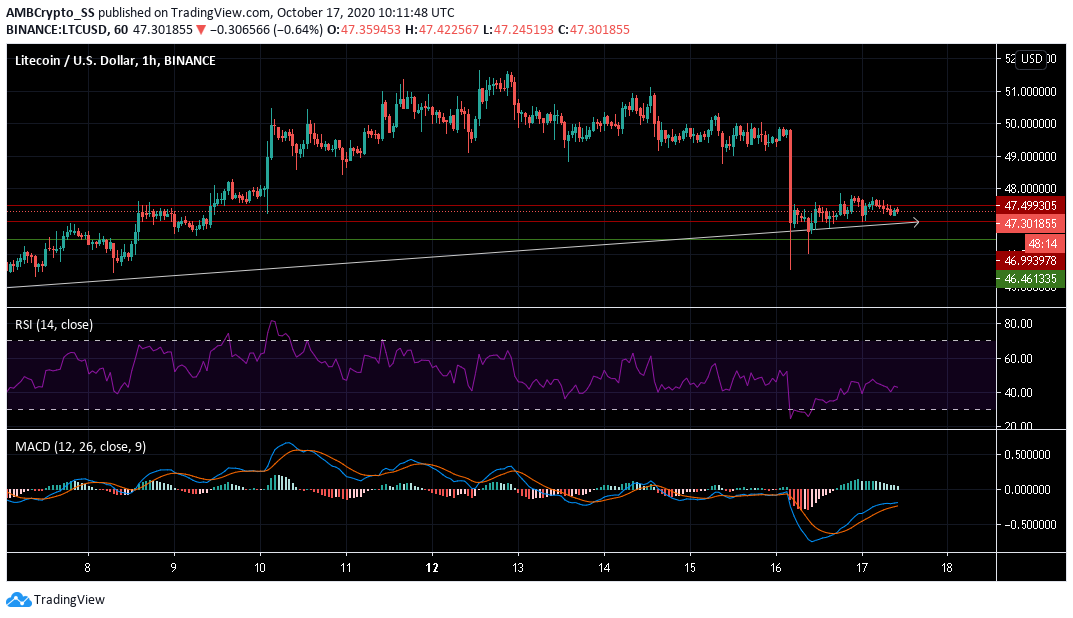
Litecoin was up by almost a percent over the last 24-hours pushing its price to $47.30 as it pushed towards its immediate resistance level. This hinted towards the possibility that the existing selling pressure may finally subside.
The bullishness seen in MACD validated the presence of buying momentum. Although the MACD line was still above the signal line, a reversal could not be ruled out.
The Relative Strength Index too, was still below the neutral 50 line. RSI was seen rising just above the 40 level.
If an upward trend in RSI gains traction, LTC bulls could push the coin towards the $ 47.499 level of resistance. However, if the bears take over, the altcoin could sink back to the $ 46.99 level
FTX Token [FTT]
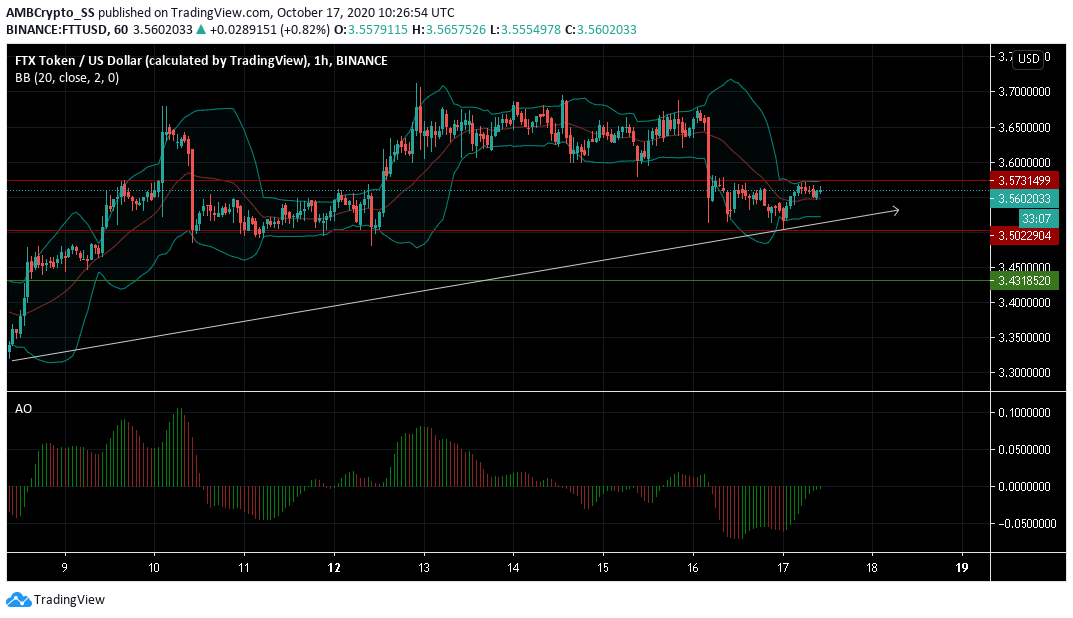
Regardless of the bears trying to stall price recovery in FTX Token for the last couple of days, the digital asset managed to bounce above $3.502 as it also witnessed a 1.2% gain since yesterday.
The green closing bars of Awesome Oscillator also validated the presence of bullish momentum. However, a very strong upward rally may not persist immediately due to low volatility levels seen in the FTT market.
The narrowing down of Bollinger bands ruled out the possibility of immediate wide price actions to either side. FTT is most likely to observe a brief period of price consolidation just below the $ 3.573 level of resistance.
Compound [COMP]
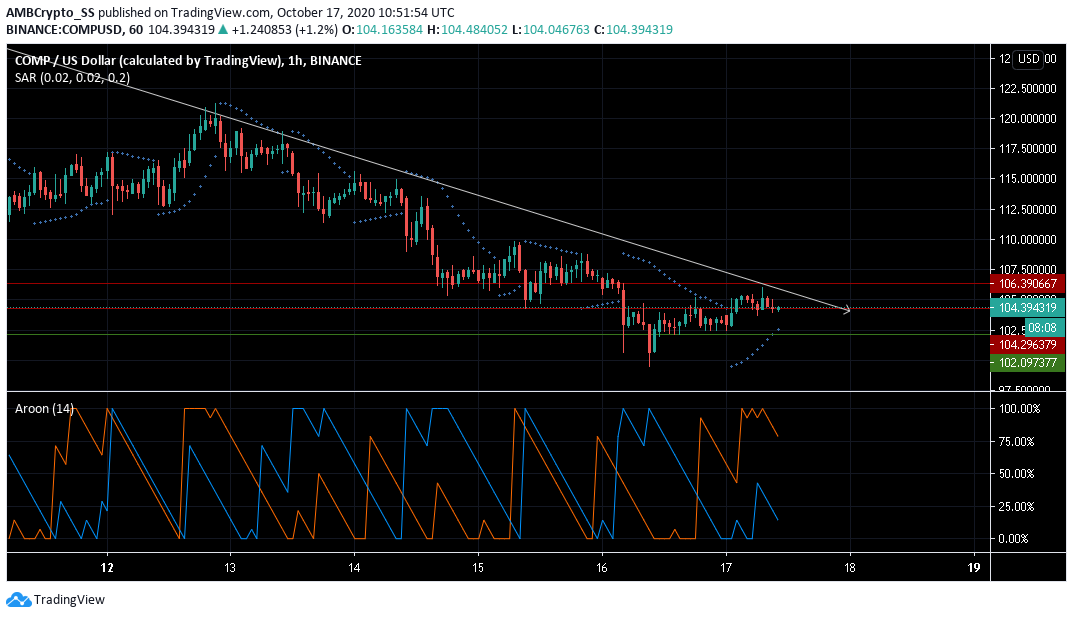
At the time of writing, Compound recorded a market cap of $347 million and gained 1.22% over the last 24 hours.
The dotted lines of the Parabolic SAR aligned below the candles supported the coin from a retracement.
In addition to the PSAR, Aroon Indicator was also bullish. Aroon Up (orange) was above the Aroon Down (blue) depicting a sentiment of buying pressure in the COMP market.
An upward price action thus could see prices bouncing back from the $ 104.29 level.
The post appeared first on AMBCrypto


