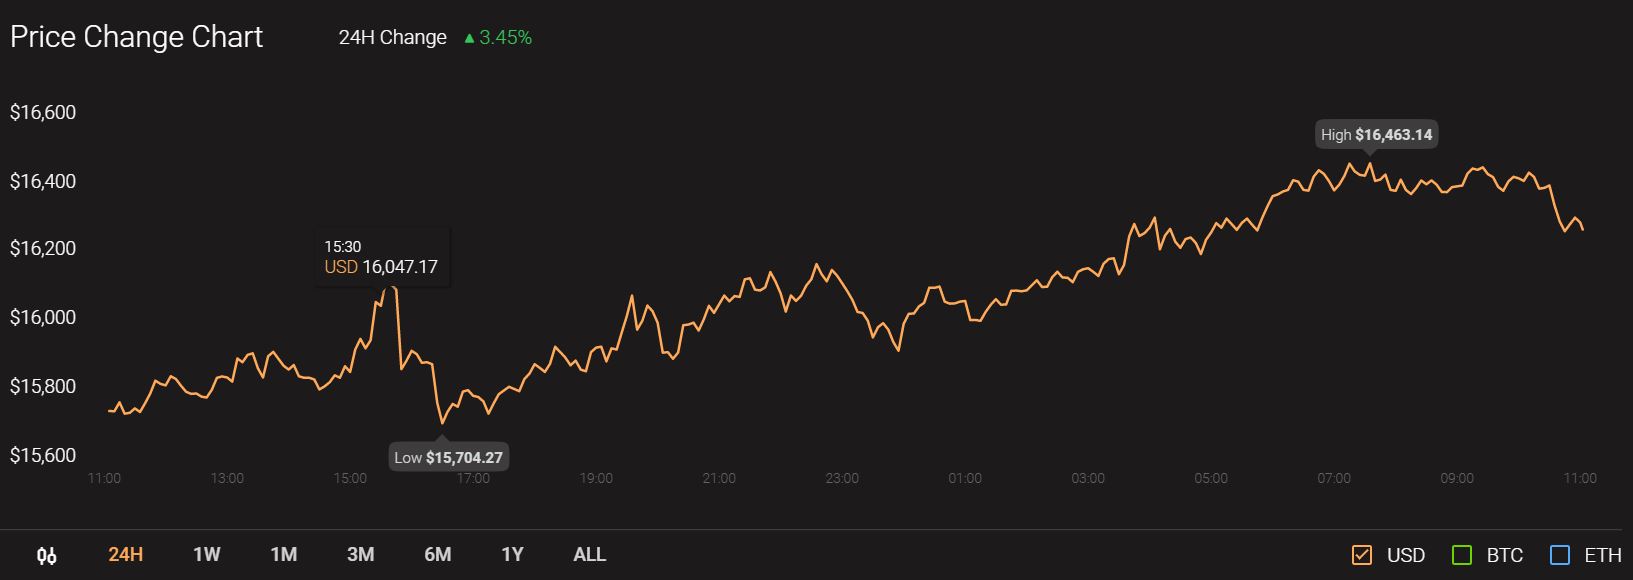
Following a period of sideways movement under the $11,000-mark in the month of September, Bitcoin’s price has risen dramatically on the charts. In fact, while October saw the cryptocurrency surge, November has seen BTC touch levels unseen since January 2018.


Source: CoinStats
Bitcoin’s performance has had a ripple effect on the rest of the crypto-market, with the likes of Litecoin and Dogecoin climbing too. However, these performances weren’t universal since IOTA continued to fall on the charts.
Litecoin [LTC]


Source: LTC/USD on TradingView
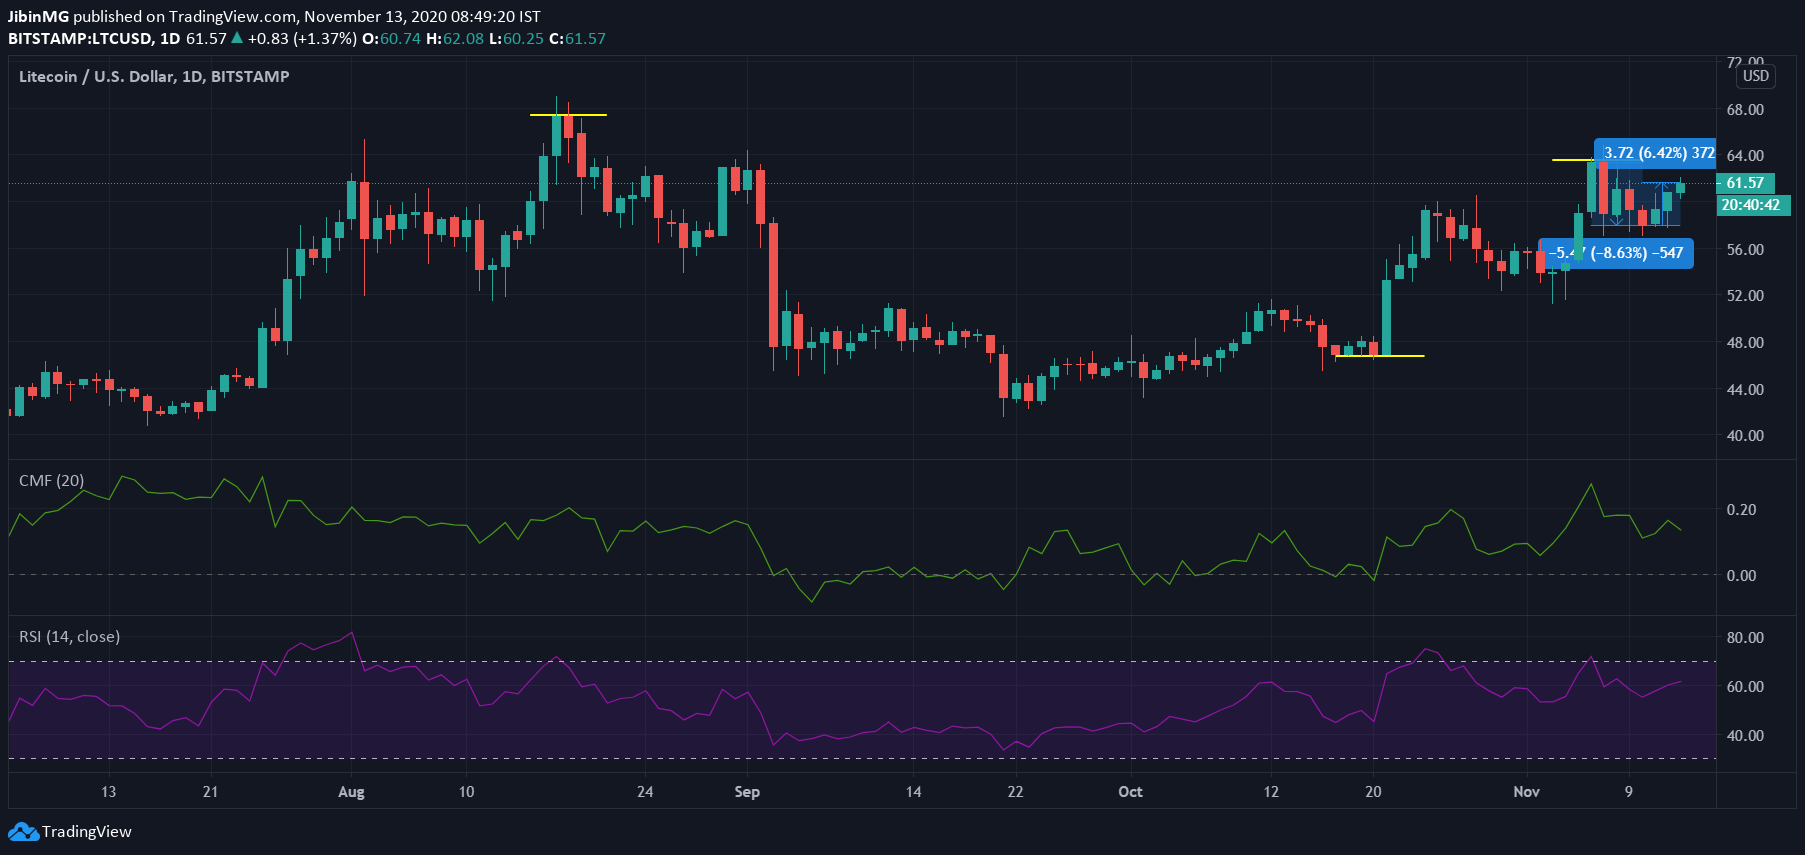
The silver to Bitcoin’s gold, Litecoin has for long been known to replicate the movements of the world’s largest cryptocurrency. The last few days weren’t very different either as LTC climbed by over 6% after Bitcoin made its most recent attempt to breach the much-anticipated $16,000-level. It should be noted, however, that the aforementioned hike came on the back of Litecoin falling by over 8%.
At the time of writing, Litecoin was trading at $61.57, with the cryptocurrency close to its resistance level from mid-August. Further, LTC was noting YTD returns of 49.73%.
Litecoin’s technical indicators evidenced the bullishness of Litecoin’s movements as while the Chaikin Money Flow was well above zero and pointed to the strength of capital inflows, the Relative Strength Index was close to the overbought zone.
Litecoin was in the news a week ago after it was revealed that Venezuela will be incorporating Bitcoin and Litecoin wallets into Patria’s remittance platform.
IOTA


Source: IOTA/USD on TradingView
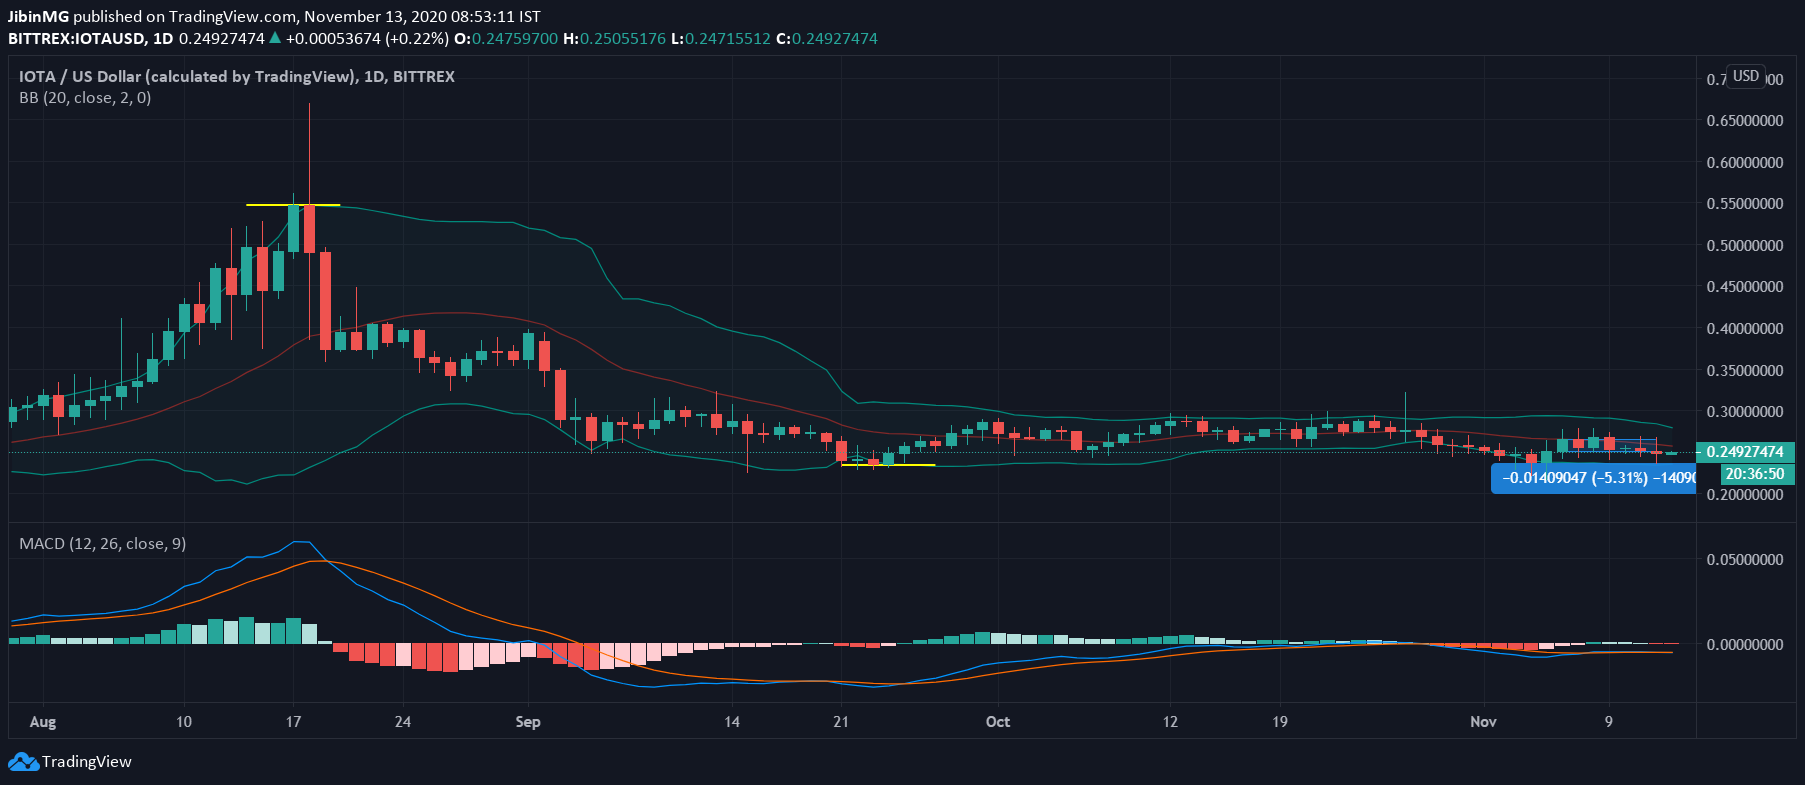
IOTA, the crypto ranked 28th on CoinMarketCap’s charts, has been trading within a tight trading channel for a long time now. The same was true after Bitcoin’s exponential surge took effect over the rest of the market. However, unlike Litecoin, IOTA’s charts didn’t see the crypto climbing on the back of the said surge. In fact, on the contrary, IOTA fell by over 5.3% over the last week.
That’s not all either as IOTA’s technical indicators revealed that the crypto was unlikely to climb anytime soon. While the Bollinger Bands were observed to contract around the crypto’s price candles, the MACD line was intertwined with the Signal line, under the histogram.
IOTA was in the news recently after its co-founder Dominik Schiener argued that DLT will transform the supply chain into a demand chain that responds to consumer behavior in real-time.
Dogecoin [DOGE]


Source: DOGE/USD on TradingView
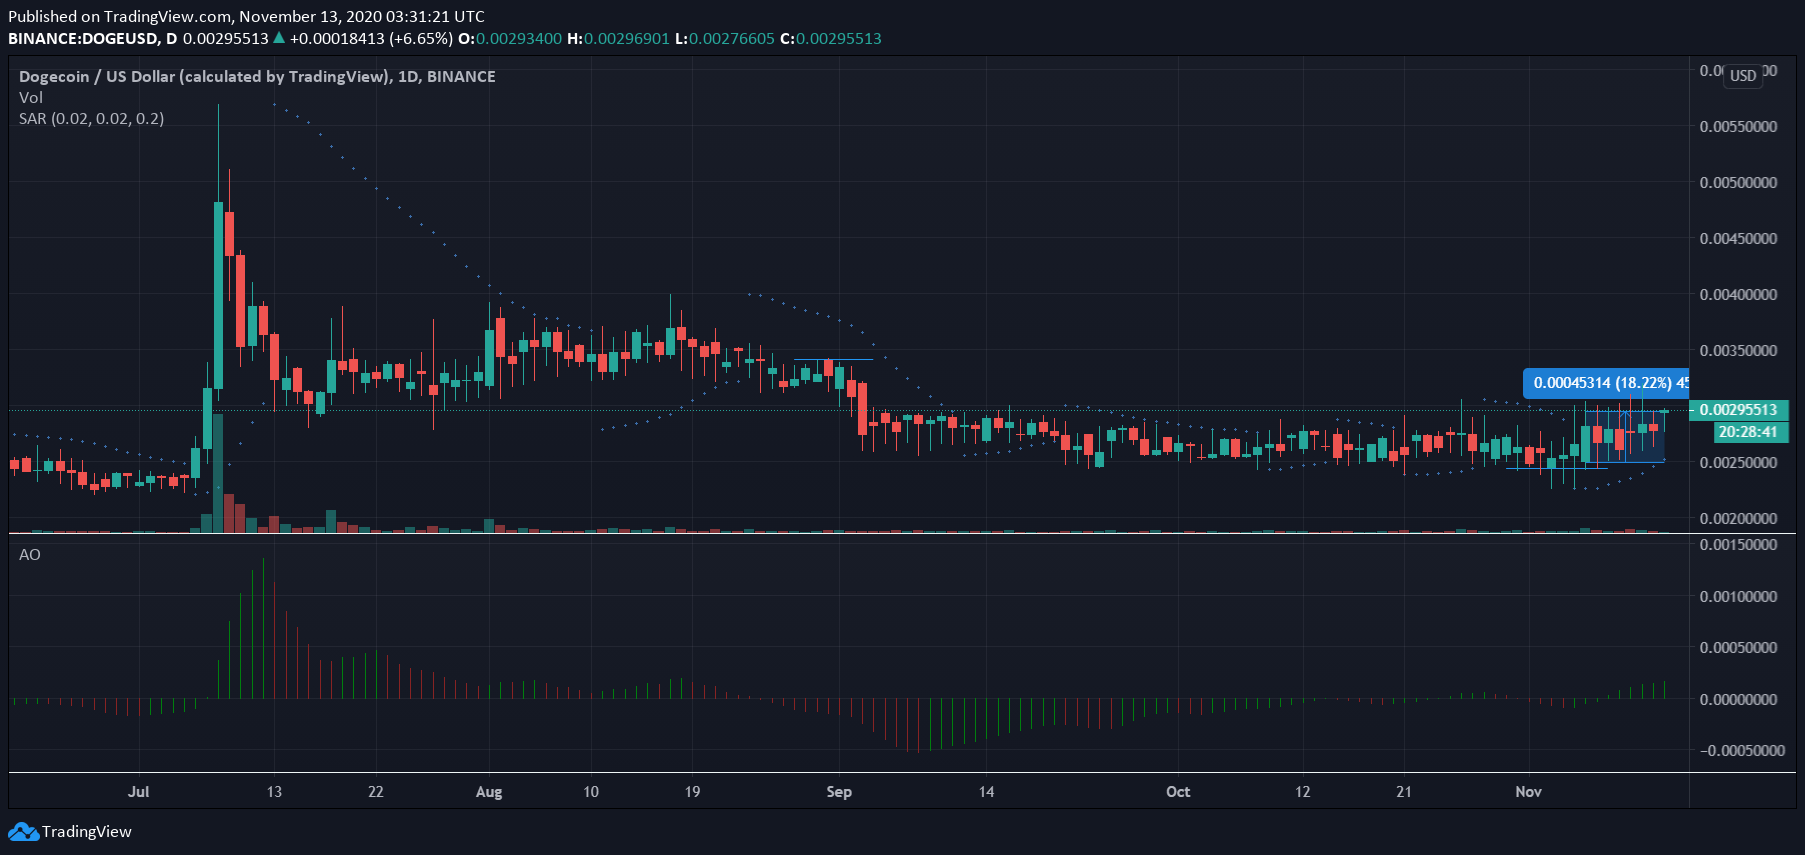
Dogecoin, the market’s premier meme-coin, hasn’t had a lot to cheer for over the past few months. In fact, since the 120% surge back in July, DOGE has fallen consistently on the charts, with the crypto soon trading within a range last re-visited back in May and June. However, thanks to Bitcoin’s recent efforts, DOGE is climbing on the charts again, with the cryptocurrency up by 18% in a week.
The recent bullishness in Dogecoin’s market can be underlined by the observations made by its technical indicators. While the Parabolic SAR’s dotted markers well well below the price candles, the Awesome Oscillator highlighted the growing momentum in the crypto’s market.
The post appeared first on AMBCrypto


