Managing to work through the market-wide sell-off today, most altcoins recorded some losses on their trading charts, with Bitcoin too trying to stay just above the $13,100 level at press time.
Litecoin was witnessing selling pressure, that pushed the digital asset beneath two of its short-term-period moving averages. Following the negative sentiment, IOTA too remained bearish.
Synthetix, on the other hand up by almost 2% since yesterday, recorded some buying pressure and could break out upwards following its week-long descending channel.
Litecoin [LTC]
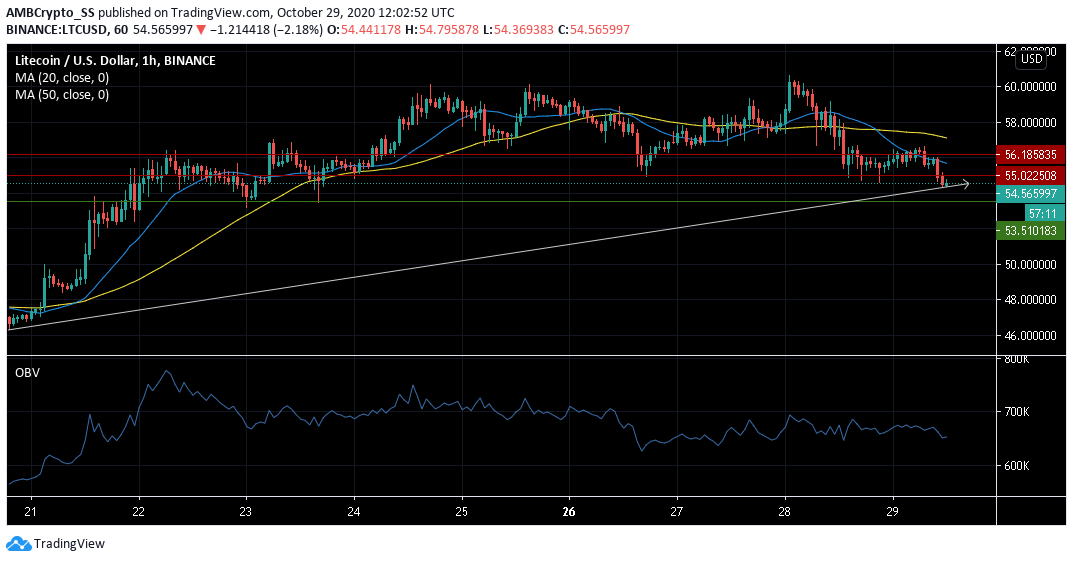
At the time of writing, Litecoin was trading at $54.56 as it dived beneath its support turned resistance level at $55.022. In fact, recording a drop in prices, LTC was down by over 3% since yesterday.
The digital asset remained fairly bearish as per its technical indicators: the 20 period Simple Moving Average (blue) was below the 50 SMA (yellow)- a sign of selling sentiment.
The price dive below the 20 SMA, further indicated that bears didn’t respect the short term trendline. While the bearishness was visible from its moving averages, the immediate price dump coincided with a neutral view picked up from the OBV indicator.
Having said this, a change in price action for LTC would follow Bitcoin’s price movement in the upcoming trading sessions.
IOTA
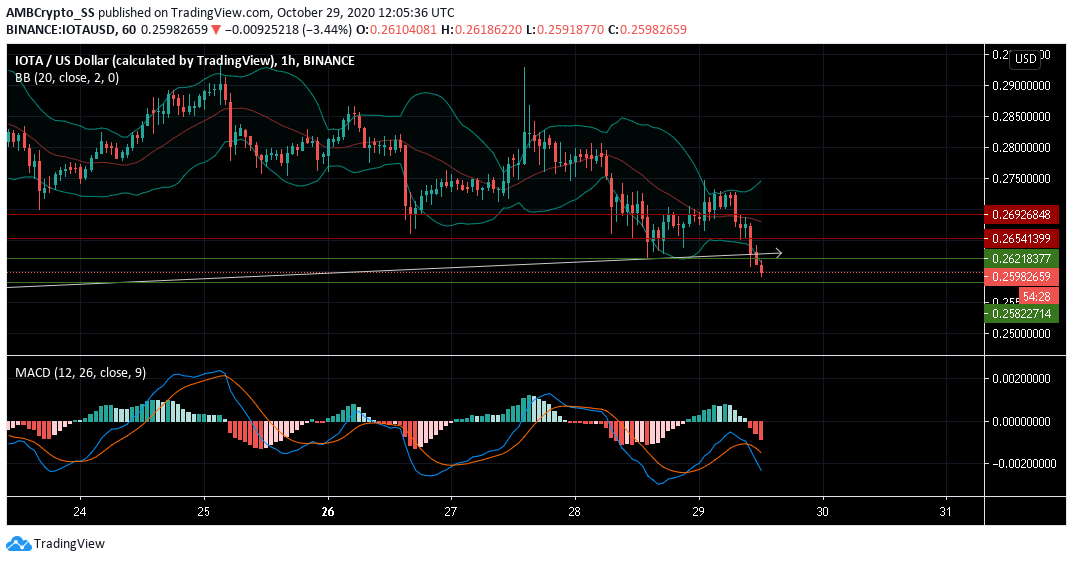
After a dump in the price of IOTA visible over the last 48 hours, it appeared to be facing another selling pressure, as IOTA fell below its trendline losing close to 4% since yesterday.
With a rise in its level of volatility, IOTA displayed a downtrend towards the $0.258 support level. The divergence of the Bollinger bands confirmed a spike in the level of volatility, and the price action seemed to side with the bears, as the prices moved along the lower band.
Further, the bearish crossover indicated by the MACD line diving below the signal line, also confirmed a downtrend, that may continue over the next few trading sessions.
Synthetix [SNX]
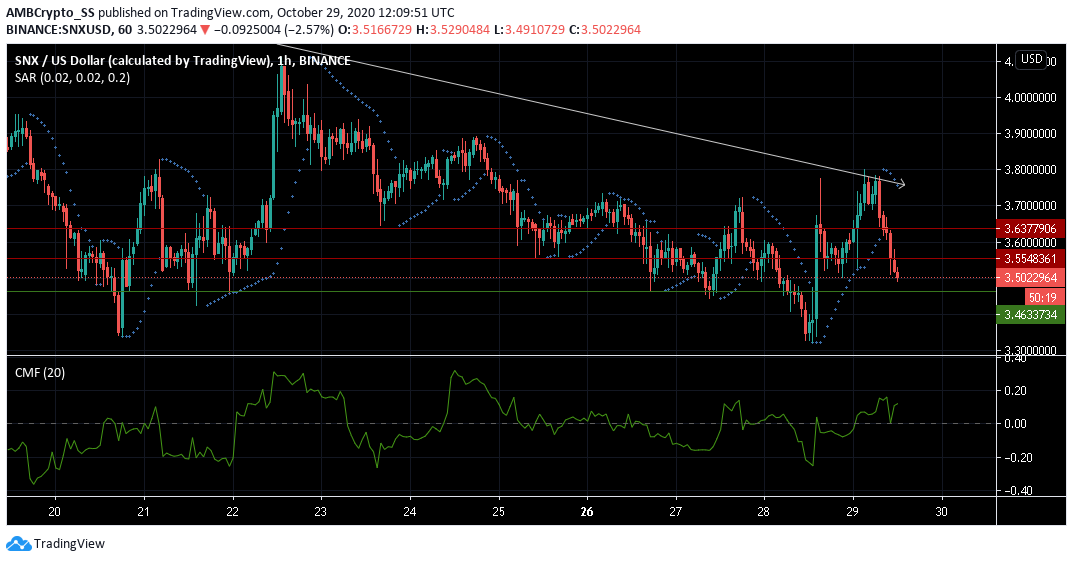
Despite Synthetix traders betting on its downtrend over the past few weeks, the digital asset recorded some gains to the tune of 2%, breaking out of its descending channel. The Chaikin Money Flow Indicator, above the zero line, was signaling bullishness.
With capital inflows being greater than outflows, fresh cash entering the SNX market added to the buying pressure. Parabolic SAR remained neutral for now. However, the price moved southwards, in a minor price correction seen, at press time.
If SNX bulls, continue to maintain price levels above the $3.463 support level, the digital asset could witness a positive rally, following the descending channel seen over the past one week.
The post appeared first on AMBCrypto


