Disclaimer: The following article attempts to analyze the emerging trends in the Litecoin long-term market and its impact on price.
The Litecoin market has been witnessing increased volatility as it surpassed its immediate resistance at $49.5 and was being valued at close to $51. However, the digital silver could not hold on to this price for long and experienced a sell-off that pushed the price of the asset as low as $45. Even as the recovery effort was underway, LTC’s current price is at its previous immediate resistance, $49.5.


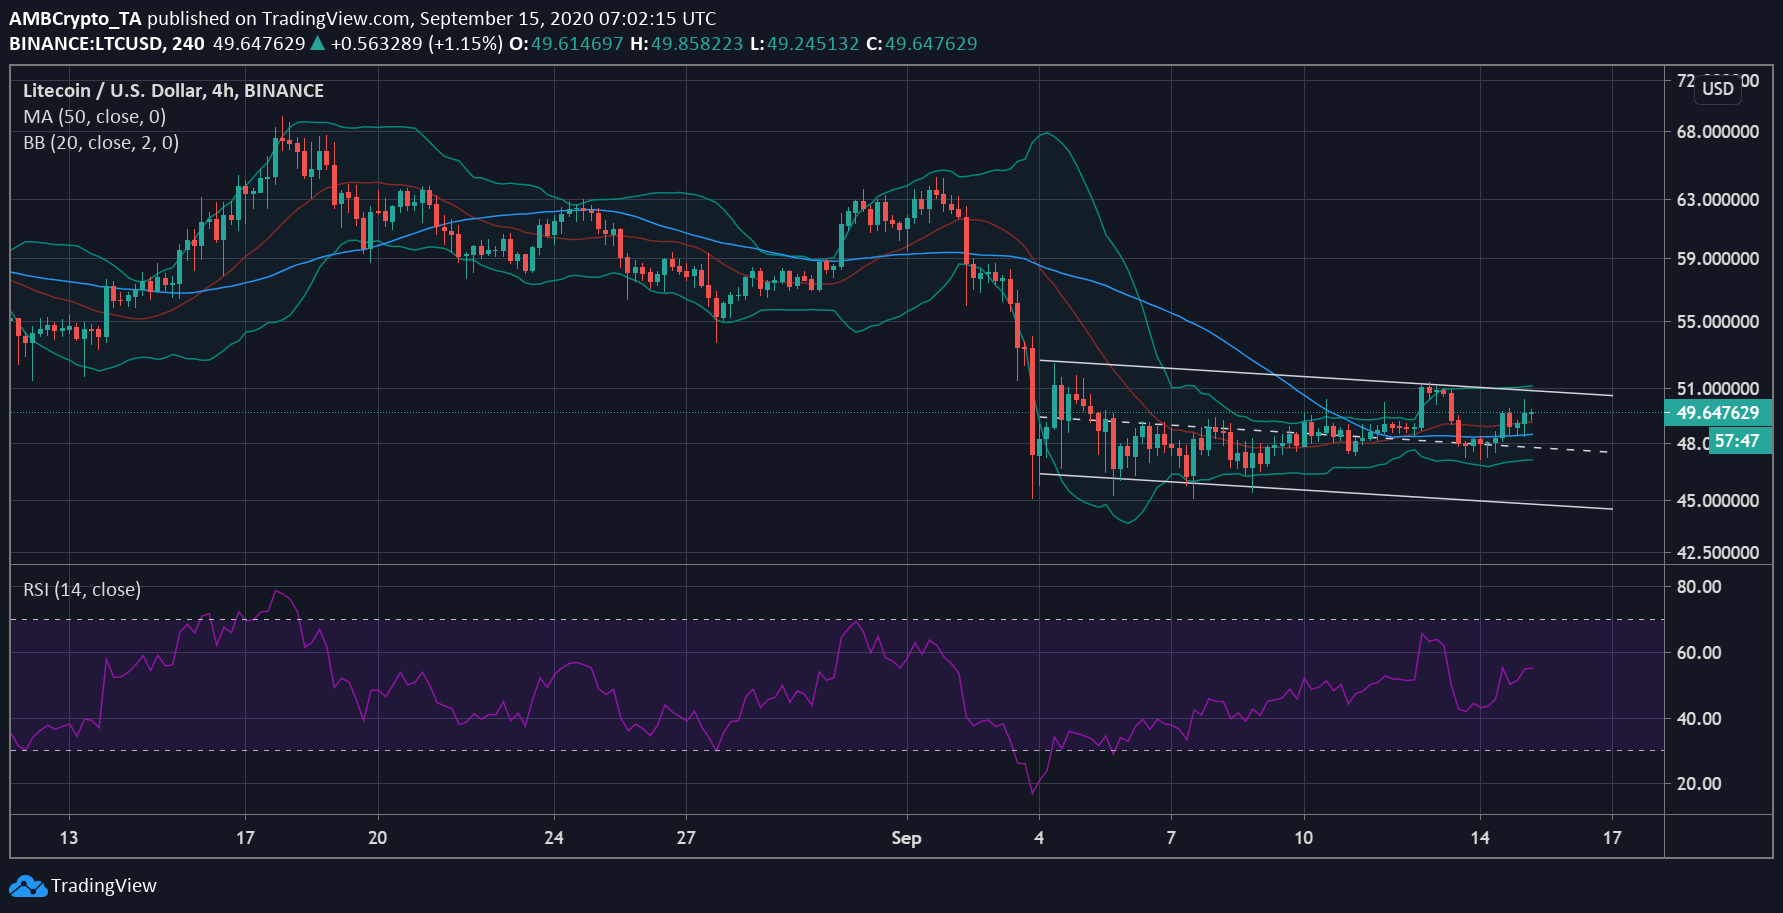
Source: LTC/USD on TradingView
The above chart of Litecoin [LTC] noted that the digital asset was losing its value gradually. The descending channel saw lowering peaks and troughs over time and suggested another breakdown in LTC’s value. However, the Litecoin market was witnessing a trend change at the time of writing.
The 50 moving average slipped under the price bars, indicating a price swing. As the price value of the coin hovered close to $49, the traders were still in a tussle. The coin has previously tested the resistance marked by the channel line at $51, but could not breach past it. The market has opened up for volatility as indicated by the diverging Bollinger Bands and a selling trend was witnessed.
The Relative Strength Index [RSI], though at equilibrium was facing the oversold zone. During the 12 September surge, when LTC price peaked at $51, the coin was going to enter the overbought zone, however, the sudden dump pushed it lower. Ever since, the LTC market has been treating the 50 MA as the resistance and support. The current price bounced off the moving average was still indecisive of the direction of the breakout.


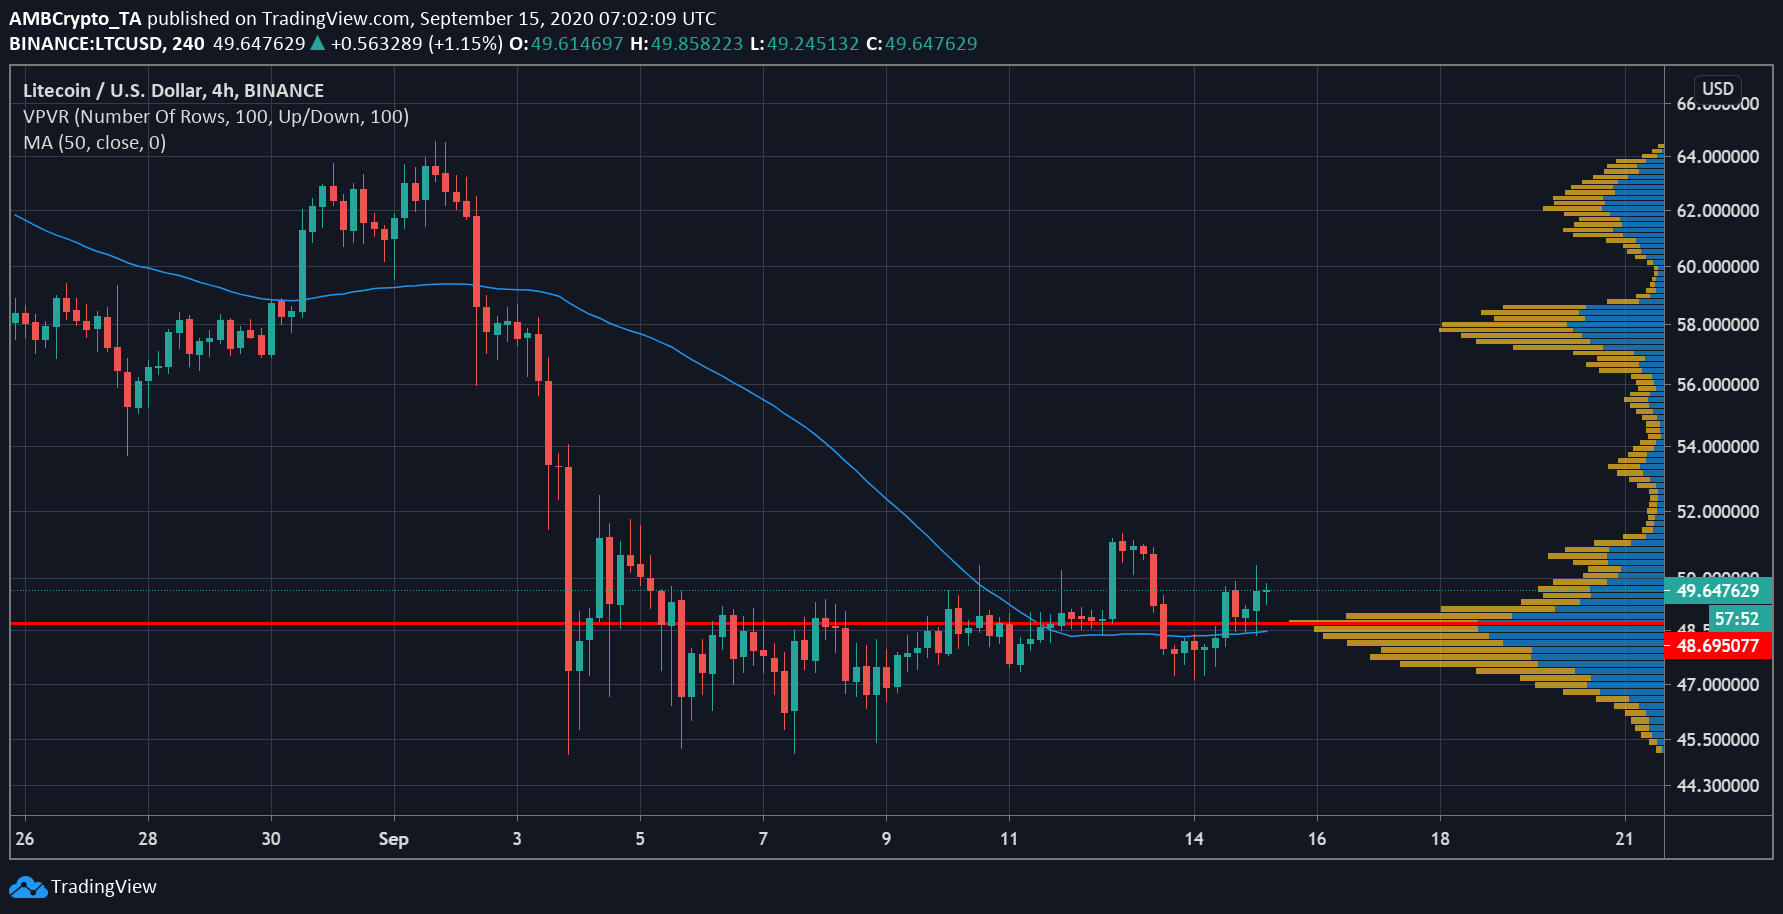
Source: LTC/USD on TradingView
The visible range offered a clearer picture of high and low volume nodes. The point of control was at $48.69, which was the price level for the period with the highest traded volume. The PoC has acted as great support recently, as the price managed to bounce back from this point. Apart from $48.6, the next high volume node was marked lower at $48.45, where the price had been after the dump on 13 September.
As the selling pressure was maintained in the market, the short term still appears bearish, however, with volatility increasing there could be a price swing making its way in the long-term.
The post appeared first on AMBCrypto


