Disclaimer: The findings of the following article attempt to analyze the long-term trends forming in the Litecoin market and its impact on the price
The cryptocurrency market has been struggling under a lot of pressure lately, a development that has inhibited its growth. Such downward pressure was shared by many of the market’s cryptos like Bitcoin, Ethereum, and Litecoin.
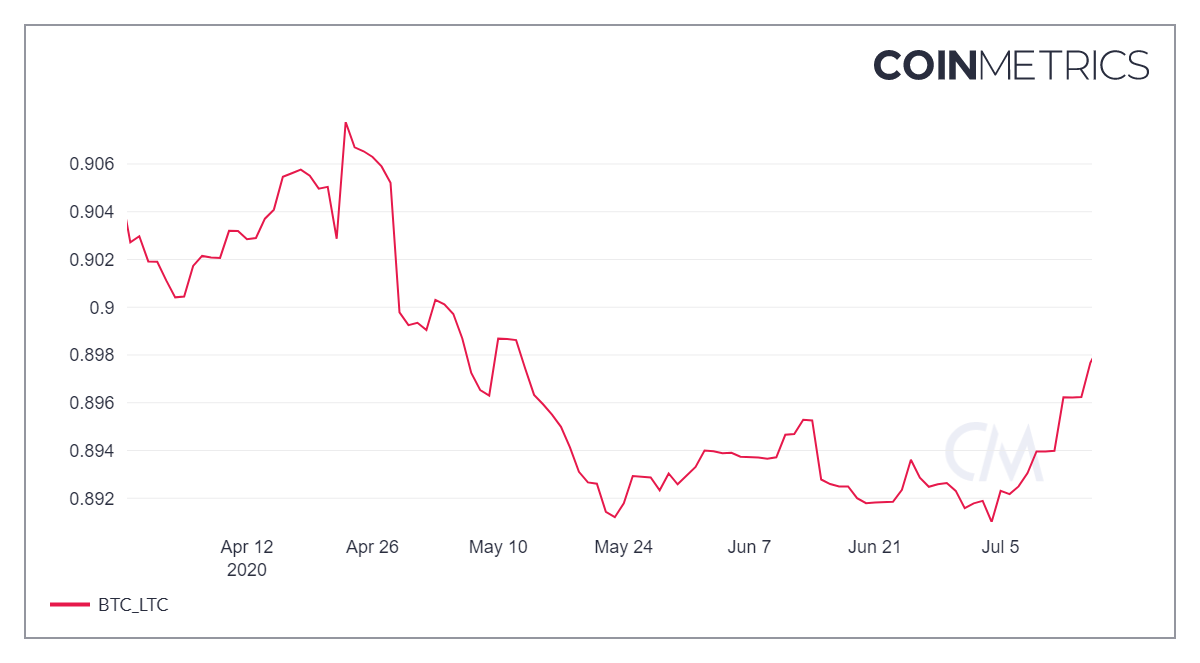
Litecoin [LTC], even though among the top 10 cryptocurrencies, has been noting a falling correlation with BTC, pushing it to rally on its own towards the end of May and in June. However, the correlation that had dipped to 0.8910 in early-July, has bounced back up now. The present correlation coefficient between BTC-LTC stood at 0.8976, making the cryptocurrency fall in line behind Bitcoin.


Source: CoinMetrics
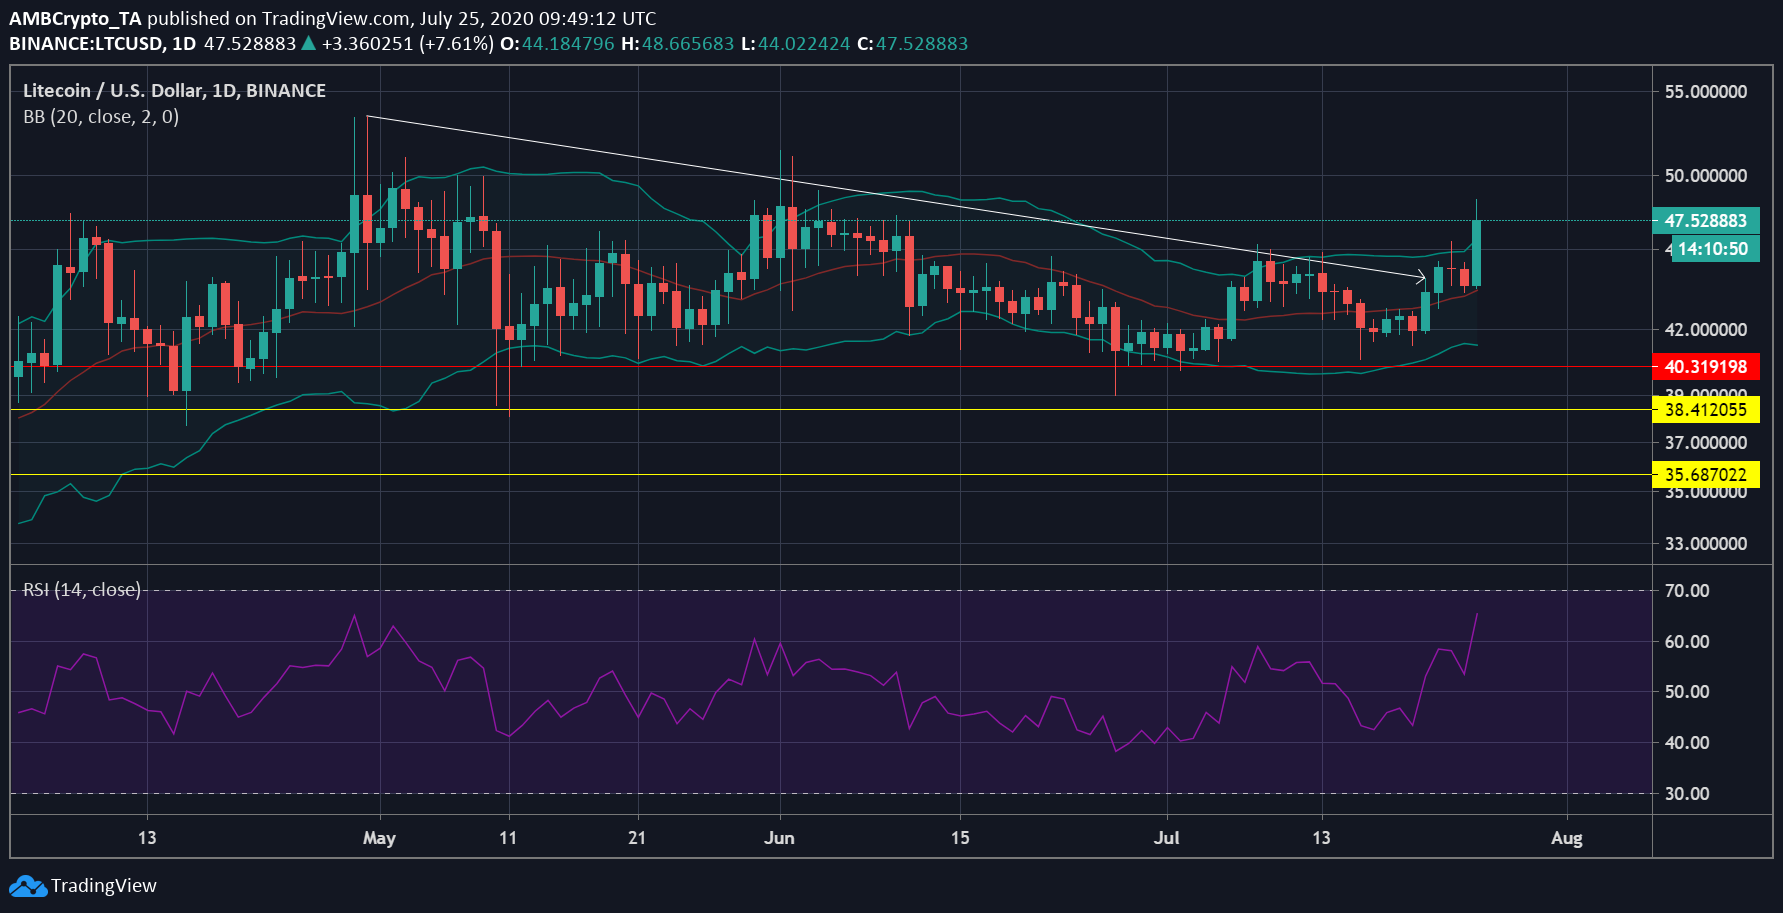
At press time, the price of Litecoin was noting an appreication. In fact, on the daily chart of LTC, the cryptocurrency had spiked by 11.11%, while being traded at $47.62. The highest level at which LTC traded during this spike was $48.66. However, this could just be an anomaly as a look at Litecoin’s charts would suggest that a bearish trend was making its way.


Source: LTC/USD on TradingView
The price of LTC had been gradually falling since the beginning of May. This dip in value gave rise to lower highs, all of which were connected by the sloping line of the descending triangle. Further, the horizontal line acting as the base of the triangle joined a series of lower lows, observed in the LTC market.
The traders may want to watch out for a move under the lower support line as it suggested the building of a breakdown momentum. If the price of LTC breaks down, there could be an active traders market ready to short the coin, pushing it further down.
As per the indicators in the market, the sudden boost in LTC’s value gave way for volatility to creep in, whereas the bearishness was also noted to be on hold. Further, the Relative Strength Index was moving sharply upwards, and if it crosses 70, the crypto-asset will be deemed to have entered the overbought zone.


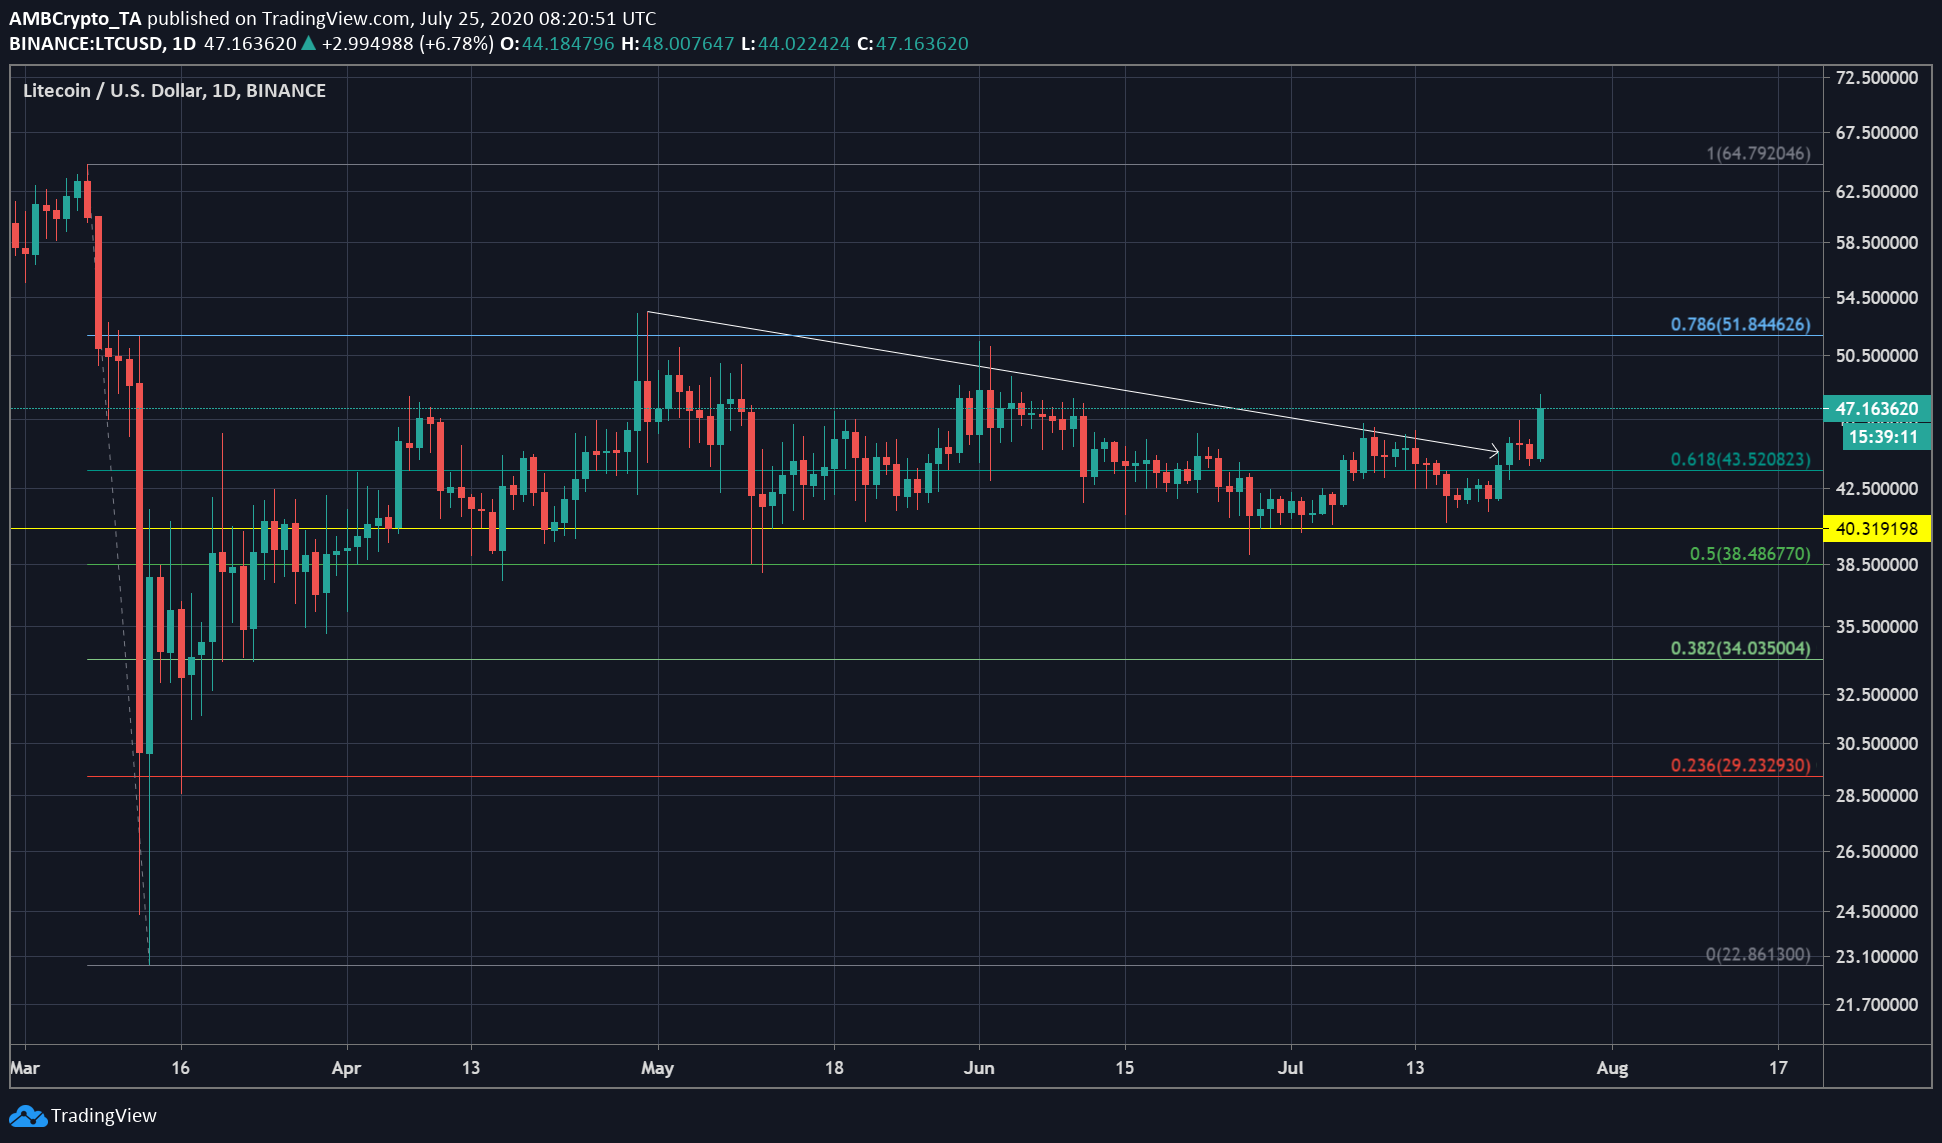
Source: LTC/USD on TradingView
Once this sudden surge in price concludes, the price may once again register downward pressure and may push the price to crumble from $47 to $40, where the base of the triangle is formed. This level has been acting as strong support for the coin, but if its slips from $40, the next stop was close to $38.
As the unexpected price hike in the Litecoin market disappears, corrections may set in. Litecoin’s price may recede to its previous levels, and test the support at $40, after which the break down will be confirmed.
The post appeared first on AMBCrypto


