Disclaimer: The findings of the following article attempt to analyze the emerging patterns in Litecoin’s long-term market and its impact on the price
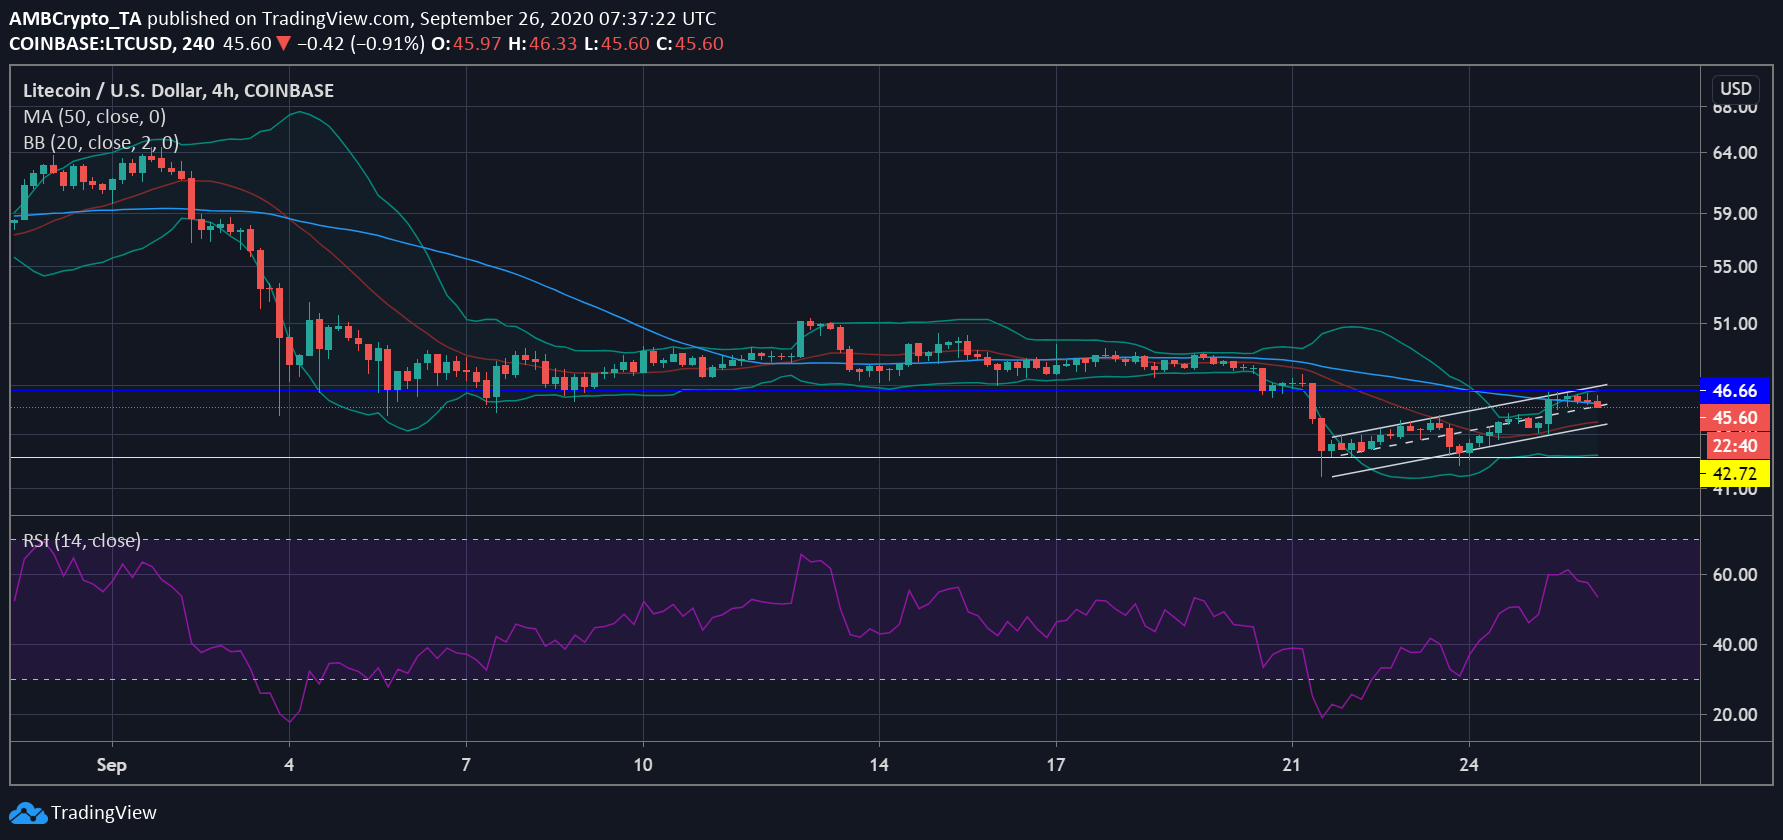
The crypto-market has been volatile since the beginning of this week, with the same resulting in price swings in either direction. At the time of writing, the prices of most major crypto-assets were heading north, including the likes of Litecoin [LTC]. However, LTC has been repeatedly testing its immediate resistance at $46.66, with the crypto unable to breach the level, despite the upwards trending price.


Source: LTC/USD on TradingView
The attached chart indicated that an ascending channel had formed, along with the rising price of LTC. Traditionally, the price is expected to break out of it and according to the indicators, a bullish breakout was possible in the long-term.
The Bollinger Bands highlighted the existing volatility in the market. The divergence of the bands at press time meant that the market expected more volatility, leading to another price swing. However, the direction of the price movement may not be known yet. The 50-moving average underlined a bearish market until recently, when the price pumped and the moving average went on to head lower on the charts. This suggested that the price trend may be changing in the LTC market.
The signal line affirmed this theory as it slid under the candlesticks when the price shot up on 24 September. It has remained under since. However, buying pressure was needed to balance it all out as the Relative Strength Index [RSI] was moving close to the overbought zone.


Source: LTC/USD on TradingView
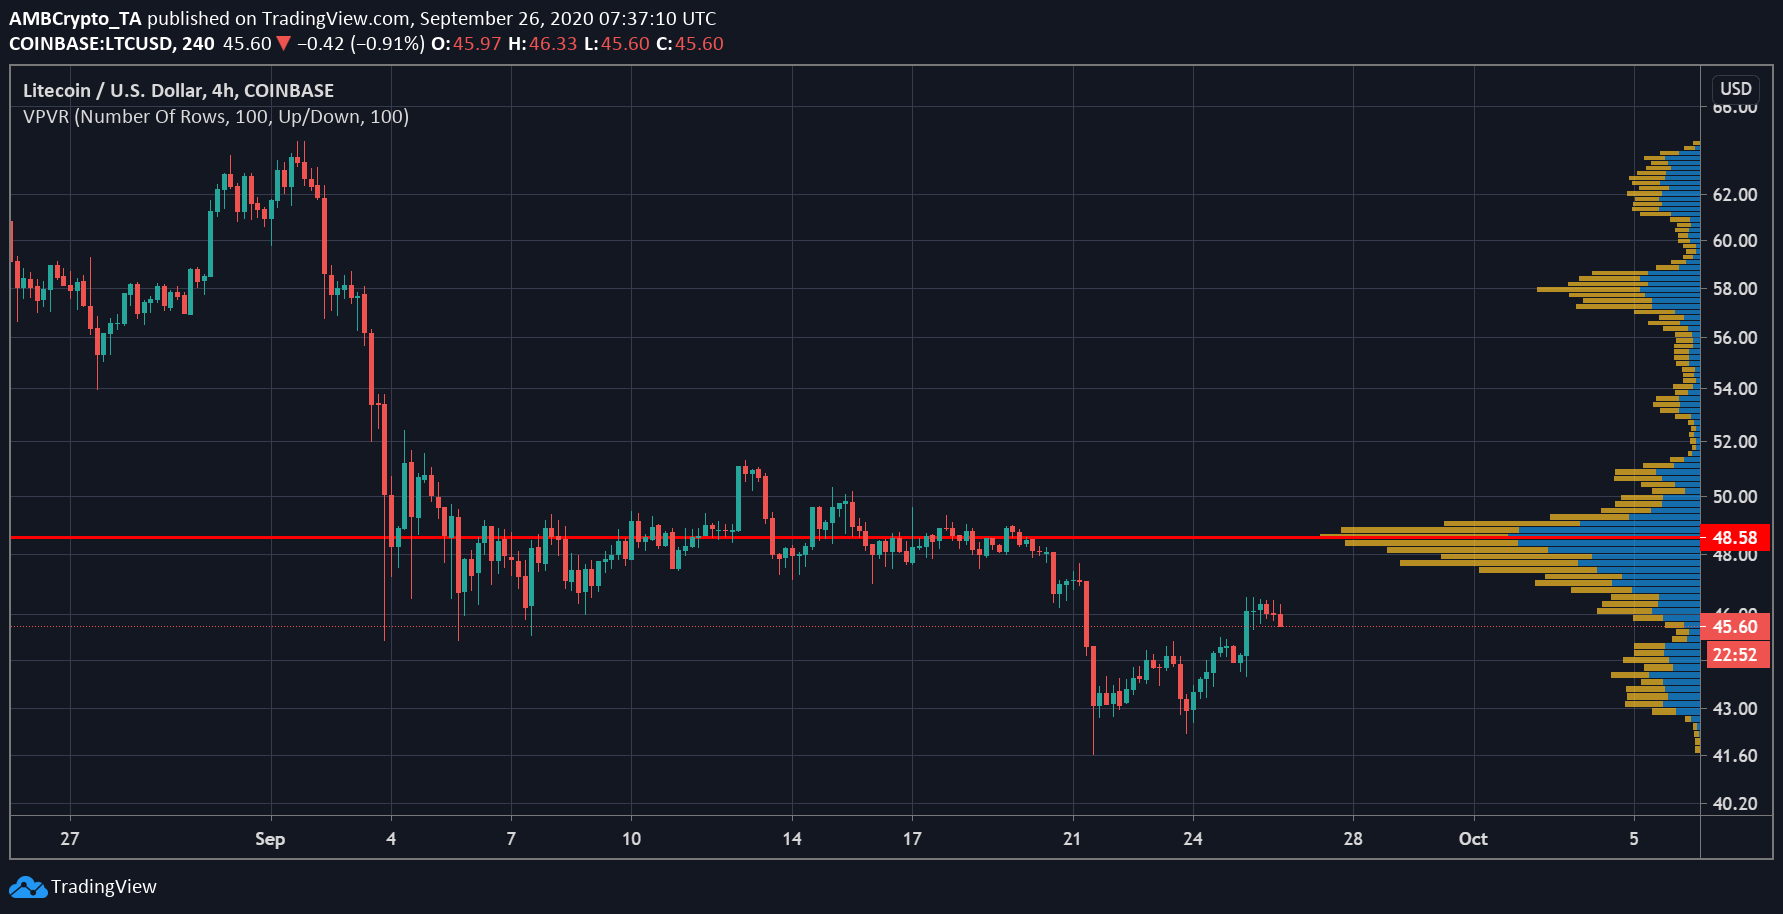
As LTC was preparing for its journey north, the cryptocurrency’s price, at press time, was under the point of control [POC] as marked by the Visible range at $48.58. This has been the highest traded price level in the given period and the sell-off on Monday led to LTC slipping below this level. With the price recovering, LTC has a long journey up ahead as higher trading nodes were also marked at $47 and $48.21.
The post appeared first on AMBCrypto


