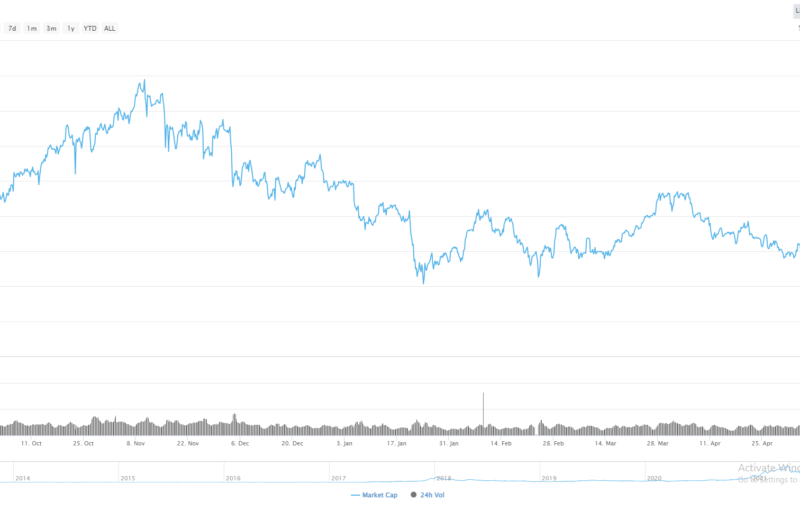
- The four-hour and daily time frame shows that multiple head and shoulders patterns are close to reaching their bearish targets
- Technical analysis highlights the $55.00 level as a possible turning point for the LTC/USD pair
Litecoin has fallen to its lowest trading level since April 2nd this year, as the fifth largest cryptocurrency by market capitalization sold-off sharply during Wednesday’s U.S trading session. The LTC / USD pair had started to appear increasingly weak over the last few days as it became apparent that buying interest was lacking above the $80.00 level.
At current trading levels, Litecoin is trading down by over fifty-five percent from its 2019 price peak, although the cryptocurrency is still up by over one-hundred and twenty percent since the start of the year. Technical analysis shows that the LTC/USD pair really started to breakdown after falling through the psychological $100.00 level on July 10th.
Traders will remember that Litecoin had a huge run higher earlier this year, following a bullish technical breakout above the $40.00 level on February 9th, which provoked a powerful rally towards the $145.00 level. It will certainly be interesting to see if the LTC / USD pair revisits the $40.00 level, although technical analysis suggests that it is unlikely at this stage.
Going forward, bearish trading patterns across the four-hour and daily time frames show that the recent decline may find strong technical support around the $55.00 level. The head and shoulders patterns on the four-hour and daily time frame both highlight the $55.00 to $53.00 region as their overall downside targets.
If we do see Litecoin reversing from the $55.00 area it has the potential to mark the end of the recent sell-off, which could develop into a huge inverted head and shoulders pattern; so it is certainly worth monitoring.
According to the latest sentiment data from TheTIE.io, the short-term sentiment towards Litecoin is neutral, at 47.80 %, while the overall long-term sentiment towards the cryptocurrency is fairly negative, at 40.00%.
The RSI indicator on the daily time frame also shows that Litecoin has moved into oversold territory, with the indicator at its lowest point in nearly eight-weeks.
 LTC / USD H4 Chart by TradingView
Upside Potential
The four-hour time frame is showing that bulls need to move price above the $72.00 level to stabilize the LTC/USD pair, while the cryptocurrencies 200-period moving average on the mentioned time frame is found at the $83.00 level.
The daily time frame highlights that a bearish death-cross is close to taking place, but not yet underway. Bulls ultimately need to lift price above the $86.00 level to change the medium-term sentiment towards the LTC/USD pair.
 LTC / USD Daily Chart by TradingView
Downside Potential
The downside potential for the LTC/USD pair is likely to open-up if we see a drop below the $60.00 today level. As previously mentioned, the $55.00 to $53.00 levels are currently the major bearish target of the head and shoulders patterns on both the four-hour and daily time frame.
A break below the $53.00 support level could ultimately spark a test of the $50.00 level, with the $40.00 level the strongest form of medium-term technical support below.
Summary
Technical analysis suggests that the LTC/USD pair could fall towards the $55.00 to $53.00 level region if the $60.00 level is broken over the coming sessions.
If bulls hold price above the $40.00 level, the recent collapse in Litecoin could prove to be a major long-term buying opportunity.
Check out our coin guide for an introduction to Litecoin.
We also wrote a DARE for the project, analyzing the future prospects of the Bitcoin competitor.
Stay up-up-to-date with our live BlockTV feed!
They even took out the ads, to show their support for our cause!
The post appeared first on CryptoBriefing


