Litecoin, owing to the misfortune of the other altcoins in the market seems to have climbed up the ladder. Currently occupying the 8th spot, LTC has moved past Binance Coin and Chainlink, which have both seen over 3 percent price declines in the past 24-hours. Litecoin’s market cap of $2.74 billion is only marginally ahead of BNB’s $2.72 billion and LINK’s $2.59 billion, but ahead nonetheless.
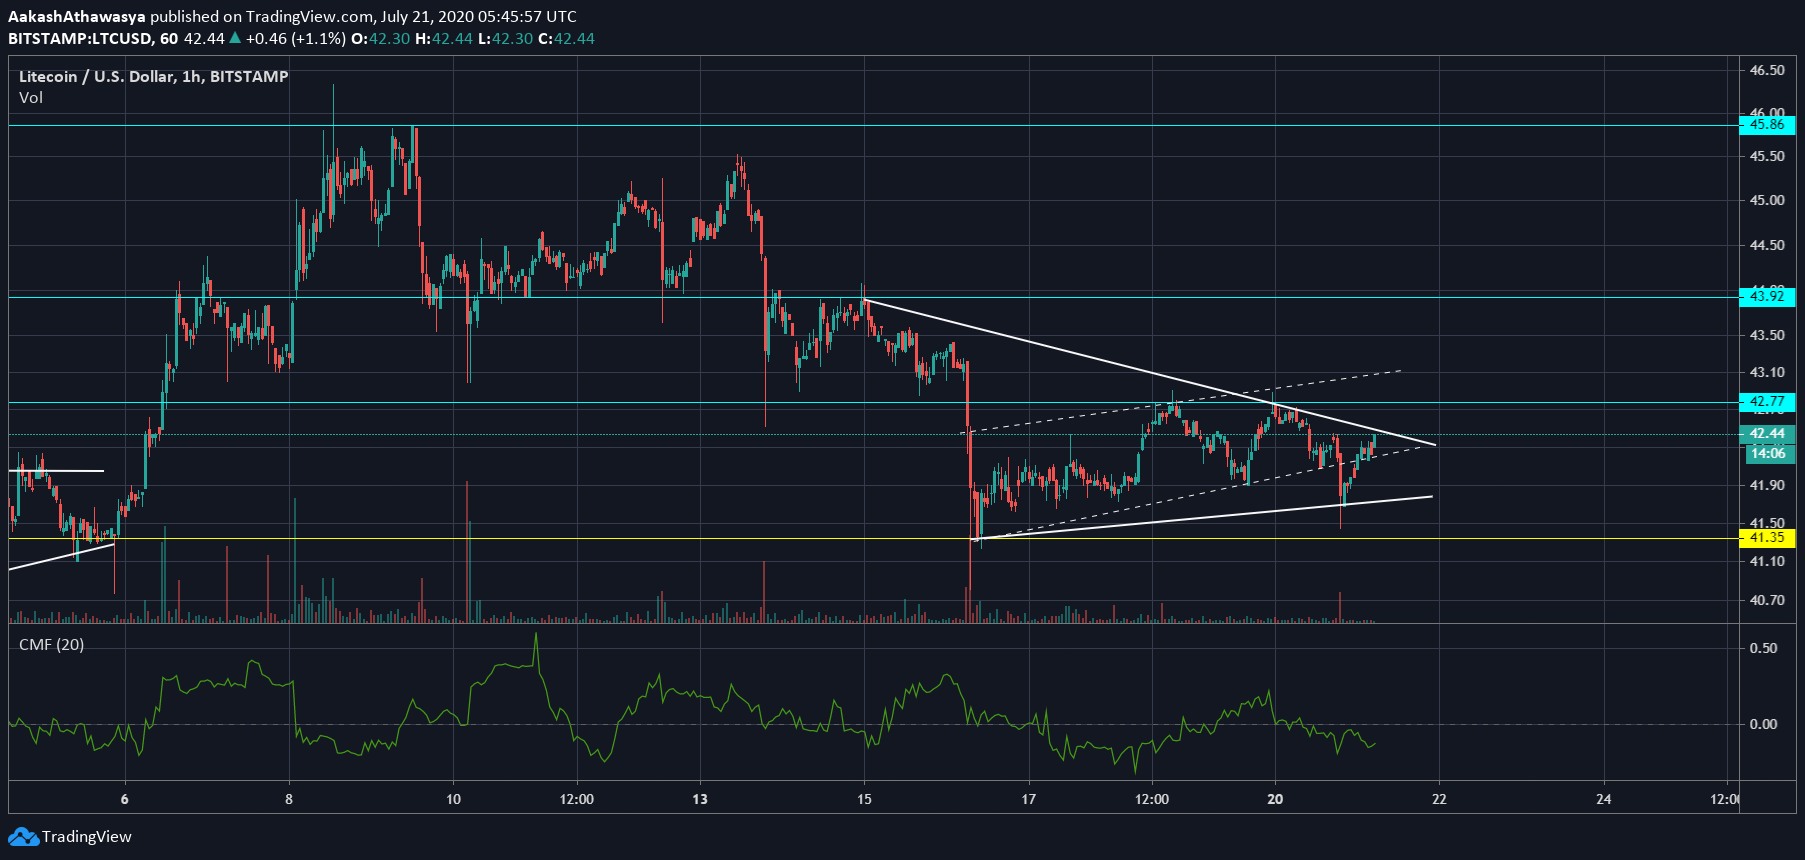
Going by the short-term hourly price, there’s very little positive news. Since LTC’s price drop between 16-17 July to the support of $41.35, with a few rogue trades lower than $40.5, there has been a slight recovery. On two occasions did the price try to break over the resistance level at $42.77 – 18 July and 20 July respectively, but the price was pushed down to as low as $41.6.
Two patterns are visible on the LTC chart. The first, in a longer time frame, is the falling wedge which began on 15 July and is persisting to date. It has pushed the prices from over $44 to under $41, and is still fairly strong. If it does continue to reign and the price does not breakout, the wedge will eventually squeeze the price till the end of the month.


Source: LTCUSD via TradingView
The other pattern is a slight bearish flag, which began after the drop on 17 July. The trading price has knocked on both extremes of the flag, escaping the lower bound on 20 July. However, this was soon undone as the price drop to $41.6 was overturned hours later as the price climbed back to its current price of $42.34. On the volume front, Litecoin’s 24-hour trade volume is now as low as $1.2 billion, whereas at the beginning of the month it was over $2 billion.
Looking at the money flow, the altcoin is witnessing leakage. The Chaikin Money Flow tool indicates negative money flow at -0.13, recovering from the previous low of -0.2, seen a few days ago, but still suggesting investors are pulling their cash out of LTC rather than putting it back in. If the CMF persists below 0 coupled with low volume, the bearish flag could result in yet another drop out of not only the flag pattern but also the falling wedge.
Two important levels for digital silver are the resistance at $42.77 and the support at $41.35. Looking at the way LTC is trading at the moment, the latter will most likely be breached in comparison to the former. If this does happen rebounds could be expected at $42.2 and $41.6.
The post appeared first on AMBCrypto


