Litecoin, the 6th largest digital asset as per the market capitalization, has seen a decline in its price since Nov 15th, 2019. The crypto has declined further in the last 24hrs. With market cap of $2,793,841,561 USD, Litecoin is trading at $43.77 USD. The LTC/USD price has seen a steady decline in the last month.
In the absence of the relevant fundamental news, LTC/USD price is declining further. As of writing, LTC/USD is trading at $43.77 USD with a 1.3% decrease. Even the LTC/BTC is 0.00610444 BTC, trading 0.44% less than a day prior.
Litecoin Technical Analysis
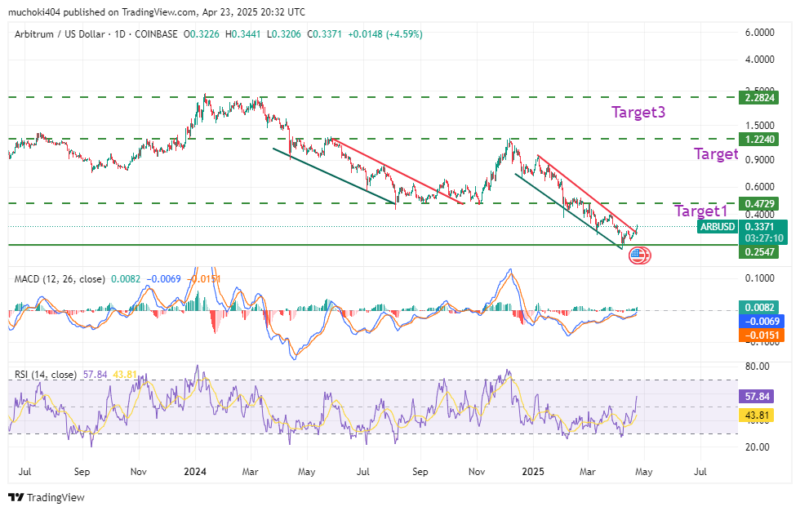
The chart shows us that the bulls were attempting a comeback before the bears squashed it and took the price below the channel formation. However, last few hours, the price has managed to break the bear trend.
Technical indicators
MACD – The MACD for LTC/USD is slowly gaining momentum in the bullish zone. However, looking at the MACD chart, the LTC/The USD price is not able to hold ground above 0 levels.
RSI (Relative Strength Index) – The RSI for LTC/USD is now well above 60 levels.
Litecoin might continue to be in a bearish trend till New Year’s eve. unless a major change comes in it way. What do you think about Litecoin price analysis? Let us know on our Facebook and Twitter pages.
The post appeared first on Coinpedia


