 (Any views expressed in the below are the personal views of the author and should not form the basis for making investment decisions, nor be construed as a recommendation or advice to engage in investment transactions.)
Whenever I step onto a tennis court, my sole desire is to atomise any green felt ball that flies over the net. However noble this pursuit, it typically leads to me rushing my shots and using too much power. I end up with way more unforced errors than winners. But even at nearly 40, I can’t seem to shake the desire I’ve had since I was 16 years old – to smash forehand, down-the-line winners. Thankfully, I realised early on that becoming a professional tennis player was not in the cards for me.
In high school, I – along with many of my tennis teammates – joined the squash team during the winter. The squash and tennis coach were the same crotchety man (and he was also my 8th grade English teacher). I had quite a temper on the court in my youth – and if I gave my racquet so much as a love tap on the wall or floor, he kicked me out of practice. Good man.
Anyway, the thing he taught me early on in my squash training was that you cannot hit winners. Due to the size of the court and players’ ability to hit off the back and side walls, a decent player will be able to dig out any ball. You can never overpower your opponent. In fact, the more power you use, the more time you give to your opponent. Instead, the best squash players put their opponent in a compromised position first, and then select the appropriate shot to force an error.
By no means am I any sort of Gaultier – I have seen him play in Hong Kong and he is truly a special human – but I have a few favourite patterns I use to get my opponent out of position. I favour my backhand drop shot, which I use to bring my opponent to the front wall. If my shot is good, then the only real response available to my opponent is a hard and deep crosscourt passing shot, or maybe – if they possess a deft touch – a high and deep lob. In any case, my retort is always a tight forehand rail (i.e., a shot straight down the side wall). This shot is harder for me to hit, because I am forced to either volley, or hit my opponent’s ball before it hits the back or side wall in order to take time away from him. The easier option is to wait for the ball to bounce off of the back or side wall – but if I wait too long, then my opponent has time to recover to the T and get back into prime position.
Should my rail be true and tight, then my opponent is sent backpedalling, chasing a ball moving away from him. He must run the farthest distance possible on the court, from the left-hand front wall to the right-hand back wall. This is much harder than running to a ball coming towards you. If my opponent gets to the ball, he will hit a neutral-to-weak rail (down the line) shot. At that point, I typically hit a deep crosscourt forehand, he responds with a rail, and then I drop him again on my backhand side. And then the pattern repeats. At some point he tires, and cannot retrieve my ball.
The realm of finance is no different than a heated squash match. We must capitalise on favourable opportunities by choosing the right asset(s) that maximise returns when we are in the proper position. As investors looking to mitigate the deleterious effects of too much global fiat money, we must choose the right asset mix. For if we fail in this endeavour, even if we are technically “investing”, all we are really doing is paying fees to intermediaries – and our wealth will not remain constant in energy terms.
Since late last year, the market has been waiting for the signal that the Fed is more concerned about economic growth than inflation. This essay shall argue that on July 27, the Fed telegraphed that, should growth disappoint, it will shift its policies towards supporting growth rather than fighting inflation. Armed with sexy chart porn, I intend to have you doom-scrolling through economic indicators of the rapidly deteriorating American economy. To support growth and a return to form in a fiat, debt-backed, financialised economy, the Fed must reduce the price of money and expand its quantity. Money printer go motherfucking “Brrrr”!
If you think my arguments are sound, then the next – and most important – decision is determining which asset(s) are likely to do best as the money supply expands once more. The opportunity to dramatically grow the energy-adjusted value of your financial assets is greatest at the transition point between money being tight and plentiful. It would be irresponsible to waste such a moment, and we must therefore be prudent and choose the right asset(s).
Should I buy stonks, bonds, real estate, commodities, gold, or crypto? Obviously, y’all already know I’m advocating crypto as the star performer in this play. However, if we think about the most liquid large-cap coins, which one should we favour over the others? The underlying assumption is that we should favour concentration more than diversification at this monetary transition point. And as a concentrated bet, I shall argue that between now and year-end, Ether will yield the best return.
Expected Value
There are two potential events which may or may not occur over the next 8 months or so, which are critical to my thesis:
- Will the Fed pivot, and signal a future rate cut and/or resumption of balance sheet expansion, aka money printing?
- Will the Ethereum merge be successful?
Investing is a time-bounded exercise, so I must set a time limit for the completion (or not) of either of these events. The time limit is March 31, 2023.
Two events with two binary outcomes means there are four possible states of the future universe.
Scenario 1: Fed Pivot + Successful Ethereum Merge (this is what I subsequently present arguments in favour of)
Scenario 2: No Fed Pivot + Successful Ethereum Merge
Scenario 3: No Fed Pivot + Unsuccessful Ethereum Merge
Scenario 4: Fed Pivot + Unsuccessful Ethereum Merge
For each Scenario, I will provide a price target, and I will assign an even 25% probability to each potential outcome. I will then calculate the average of all of these price predictions to yield an ETH/USD price prediction and expected value for 31 March 2022. If this expected return is positive, then I will feel comfortable adding to my long Ether position. If it is negative, then at a minimum, I will not sell more filthy fiat for Ether.
With this analytical construct in place, let us begin.
Monthly Payments
Every human is born into the universe short of shelter. The lucky ones receive a dwelling from their parents, but most of us must find a way to buy or rent shelter once we enter adulthood. Financing the purchase of a house or apartment is one of the largest activities of any financial institution. America is no different.
As the sophistication of financial services grew over the past several decades, banks began financing a larger portion of residential real estate. Banks wanted to lend out their large and increasing balance of excess reserves, courtesy of the Fed, to an asset class that is low risk. The safest loans banks can make are against hard assets, and houses are at the top of that list. Should you default on your mortgage, the bank can repossess your house and (hopefully) sell it for more than the remaining loan value. The housing market is also liquid, to some extent – everyone needs to live somewhere, and it is also explicit US government policy to encourage home ownership through a variety of programs. So, as time went on, banks started pouring more and more of their free capital into housing loans.
The widespread availability of financing for homes and the willingness of banks to accept additional risk allowed more and more people to take out a mortgage to purchase a home. At some point, the price of the dwelling became irrelevant. The only thing that mattered was whether the borrower could afford the monthly mortgage payment out of their disposable income. The result was that the housing market became completely dependent on the cost of financing, which is determined largely by the central bank via its setting of the short-term risk-free rate (more on how that works in a bit).
Case Shiller US National Home Price Index (white) vs. the US CPI Index (yellow)
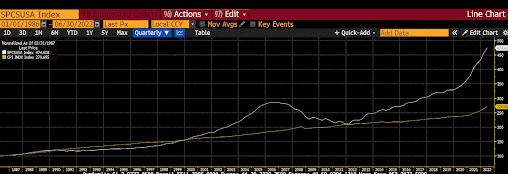
The chart above starts in 1985 and each data series is indexed at 100. As you can see, housing prices have risen 75% faster than government-measured inflation over the past four decades. If everyone had to pay cash for a dwelling out of their savings, the prices would be much lower. But if you can afford the monthly mortgage payment, you can afford to purchase a more expensive house. This behaviour drives the price higher, and is fueled by the willingness of the bank to extend credit to home buyers.
How else can the average Joe afford the “American dream”?
70% of US GDP is consumption. America transitioned from a manufacturing powerhouse to a financialised service economy starting in the 1970’s. Essentially, every item that can be used as collateral for a loan is eligible for financing. The majority of Americans live paycheck to paycheck, which means their entire lifestyle is dependent on the monthly payment.
“PYMNTS’ research found that 61% of U.S. consumers lived paycheck to paycheck in April 2022, a nine percentage-point increase from 52% in April 2021.”
The calculation of the rate at which a bank will lend against your car, house, or other consumer goods starts with the return rate the bank receives when parking money with the Fed. (Given we are talking about America, I will stick with describing the US money markets). This is called the Interest on Excess Reserves (IOER). The IOER rate is between the fed funds rate’s lower and upper bound (which the Fed sets at its meetings). This is one of the tools the Fed uses to translate its policy rate into the actual rate observed in the market.
If a bank takes your deposit and pays you 0%, it can turn around and immediately earn 2.40% risk free by loaning it out to the Fed. Great business. Given the market is competitive, if bank A offers a 0% deposit rate to consumers to make a +2.40% spread, bank B could offer a 1% deposit rate in order to steal business from bank A, and still make a +1.40% spread. The banks will thus compete by offering higher and higher deposit rates until they closely match the IOER offered by the Fed.
If the bank must pay a deposit rate close to the IOER, then it must charge a higher rate than IOER when it lends against other collateral. The popular fixed-rate American mortgage is a bit more complicated to price due to the prepayment-free option given to home buyers; however, a similar principle applies. The more expensive the risk-free rate is with the Fed, the more expensive your mortgage rate will be.
US 30-year fixed mortgage rate (white), Fed Funds upper bound (yellow)
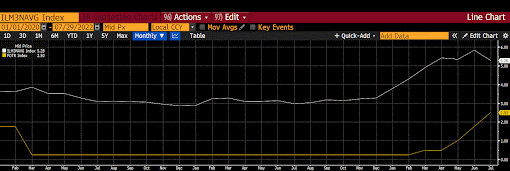
The chart above clearly shows that the higher the Fed sets interest rates, the more Americans pay to finance their homes. This is extremely important to the health of the US consumer, as the monthly mortgage payment represents a large percentage of the median household’s disposable income.
|
Median House Price |
$416,000 |
|
|
Median Disposable Income |
$51,427.00 |
|
|
30-yr Fixed Mortgage Rate |
3% |
5% |
|
Monthly Payment |
$1,753.87 |
$2,233.18 |
|
% of Disposable Income |
40.92% |
52.11% |
Mortgage rates started the year at around 3% and are now slightly above 5%. As a result of this change – and as illustrated by the chart above – the median US household balance sheet has deteriorated by more than 10%. This is obviously only true for those currently securing financing to purchase new homes – but the mortgage rate is just one aspect of the equation. The bigger issue is that the loan amount continues to grow faster than inflation. Recall the above chart of house prices vs. inflation, and imagine what it would look like if the price of the median home was reduced to match the 75% rise in inflation since 1985. The household balance sheet would be something like this:
|
Median House Price |
$237,714 |
|
|
Median Disposable Income |
$51,427.00 |
|
|
30-yr Fixed Mortgage Rate |
3% |
5% |
|
Monthly Payment |
$1,002.21 |
$1,276.10 |
|
% of Disposable Income |
23.39% |
29.78% |
Under this scenario, households would have a much larger percentage of income left over for other necessities. The more the median household’s finances are stretched by the cost of financing their mortgage, the more likely they are to resort to other consumer finance instruments – like credit cards – to afford life’s other essentials.
US Household Debt as a % of GDP
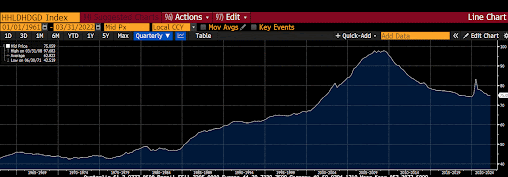
US Consumer Credit Outstanding
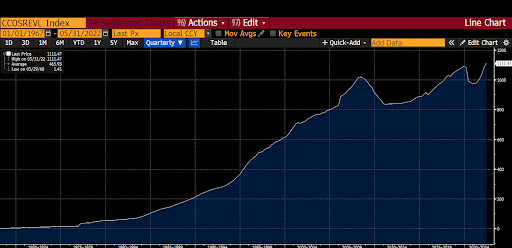
These charts above clearly show that households have resorted more and more to using credit to finance their existence.
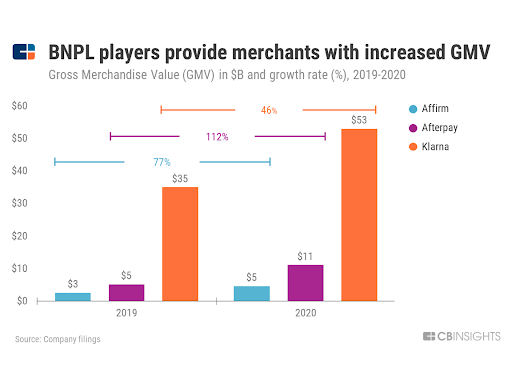
The new, woke form of credit cards for the youngin’s – who eschew traditional forms of credit but borrow money nonetheless – is Buy Now Pay Later (BNPL). The Gross Merchandise Value (GMV) figure represented in the chart above is basically the loan balance carried by the customers of the top BNPLse fintechs. As you can see, almost $70 billion dollars of GMV was financed in this fashion in 2020. The old folks use credit cards, and the youfs use BNPL–, same same, but different.
America is a car country. Whether deliberate or not, the lack of public transportation connectivity between suburban and urban areas and in major population centres is shocking. America is the wealthiest country in the world, and yet it’s easier to get from Beijing to Shanghai than Washington D.C. to New York City. For the average American making the average wage, owning a car is required to get from home to work. The family car is yet another asset that must be financed due to its high price. According to the Kelly Blue Book, the average car currently costs $48,043 – a new all-time high. If you make $50,000 a year, and the average car costs $48,000, you financin’ that bitch!
US Commercial Bank Auto Loans
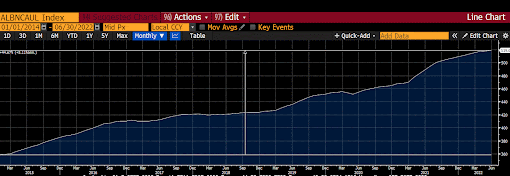 The above dataset from the Fed goes back to 2015. The auto loans outstanding have jumped 44% over the last 7 years.
Housing and autos are two examples of the life-critical assets that must be financed by American households. The rate that determines the monthly payments Americans must make for these essentials is directly influenced by the fed funds rate. Therefore, as the Fed makes money more expensive by raising rates, it directly makes the vast majority of American households poorer.
The effect the Fed has on household balance sheets is directly related to the size of the loans held by those households. If the price of the average house or car suddenly drops by 50%, then the Fed raising rates a few percentage points wouldn’t make much difference to households – because, while the interest rates they would pay on their house or car would be higher, their net monthly payments would likely be lower. However, we are at the end of an over 50-year period of intense financialisation of the American economy, which has driven an exponential rise in the price of any asset that can be lent against.
If you can’t afford the monthly payment, you can’t purchase the house, car, or other durable good. If the buyer needs to pay less, then the seller has to sell for less. And then at the margin, the entire stock of houses, cars, and other financed assets become worth less. Given those assets are financed by debt, that becomes a problem for the bank that lent against that type of collateral – because they will be seizing assets of much lower value when the folks they are lending to can’t make their loan payments.
As asset prices fall, banks become more conservative with who they lend money to and what they lend it against. The flow of credit to these assets slows and gets more expensive. This feeds back into the market and drives prices even lower. The buyer can’t afford the monthly payment at terms the bank is comfortable with. At this point, the price of the asset must fall to a level where the buyer can afford the monthly payment at the higher financing cost. While prudent, this actually degrades the entire stock of the bank’s loan book to US households. This is a circular, reflexive process which leads to the dreaded debt-backed asset DEFLATION!
As I have said many times, the goal of the central bank is to print money to support asset prices such that the deflation of assets does not occur. A fractional reserve banking system cannot survive asset deflation. So, the Fed or any other central bank must act IMMEDIATELY if they believe deflation is on the horizon. This is the lesson taught to any and all folks in “proper” economics programmes. Most of the academic staffers at the Fed (or any other central bank) have written papers on and studied the Great Depression. They believe the Fed erred by not printing money and supporting asset prices and staving off the deflationary impulses of the various developed economics in the 1930’s.
The takeaway from this whole section is that the health of the American consumer – and by extension, the American economy – is directly correlated to the fed funds rate. If interest rates rise, the economy suffers. If interest rates fall, the economy prospers. While you might think that a governing board of unelected bureaucrats determining the fate of the most successful “democracy” is a bit odd, that’s just how the cookie crumbles.
二选一 (Pick One of Two)
This phrase was made famous in China when Alibaba, the e-commerce giant, was accused of forcing merchants to choose between selling their wares on one of two platforms – Alibaba or one of its competitors – rather than being able to work with both.
The Fed is facing a similar “pick one of two” dilemma. They can either choose to fight inflation, or support the financialised American economy – but they can’t do both. Fighting inflation requires increasing the PRICE of money (USD) and decreasing the QUANTITY of money. The prescription for a “healthy” American economy requires the exact opposite.
In March 2022, with inflation starting to enter surge pricing, the Fed decided that the American economy could handle higher rates – raising the fed funds rate for the first time since 2018 by a quarter of a point. Surely, with unemployment at all-time lows, the engine of America could deal with a few percentage points higher on the fed funds rate?
Wrong.com
Feast your beady little eyes on the below charts, which point to an American economy in decline. If you ascribe to the textbook definition of a recession, as taught by “proper” economics programmes – i.e., two sequential quarters of negative real GDP growth – then the American economy as of Q2 2022 is officially in a recession. I know, I know – those “book” things are so passé. It’s much better to ingest the economics memes of the White House press office. Soz.
One…Two…Buckle my shoe
US Real GDP % Growth
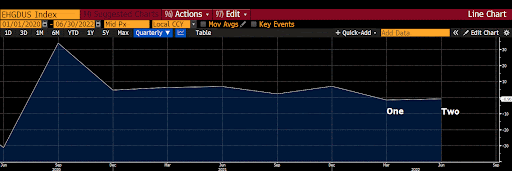 Remember – the Fed’s first rate hike occurred in March of this year. It’s quite a coinkydink that the first quarter of negative GDP growth also transpired in the first quarter of the year.
Nothing lasts forever, but the current crop of economic “isms” all believe that national economies must and can grow ad infinitum. That is why a recession or negative growth is such a big deal to those who are supposed to be leading us to the promised land.
As of the end of 2021, housing related activities represented 9.20% of US GDP. Take a gander at this beauty.
US Existing Home Sales % Change YoY
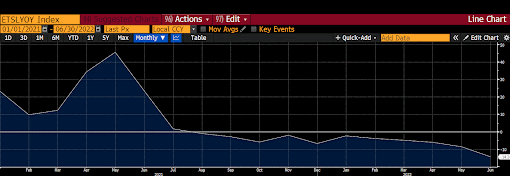 US Existing home sales were 14.22% lower in June of 2022 vs. June of 2021. Did the US housing sector loan money to Three Arrows?
Here is another smattering of ugly US housing data, courtesy of Quill Intelligence.
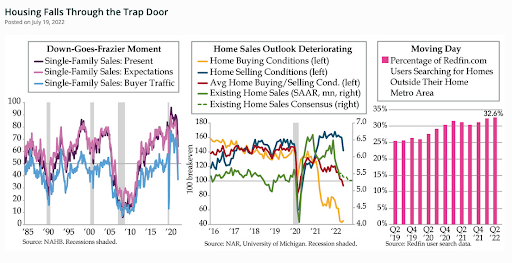 Americans are more pessimistic today about the economy than during the height of COVID. Let me say it again for the folks in the back: millions of people died due to COVID in America, but people are more despondent today. Rhetorical question: would you rather have the fed funds at 0%, or a cure for COVID? Don’t answer that – I know it’s a loaded question. We obviously have neither.
University of Michigan Consumer Sentiment
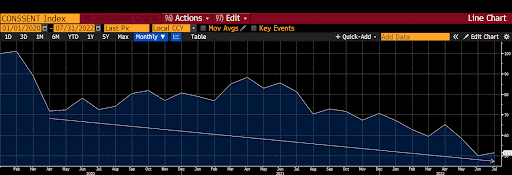
Surely if the US economy is slowing so quickly in the face of non-zero short-term interest rates, then inflation must be declining rapidly, right? Oh, no, no, no!
US CPI % Change YoY (white) vs. Fed Funds Upper Bound (yellow)
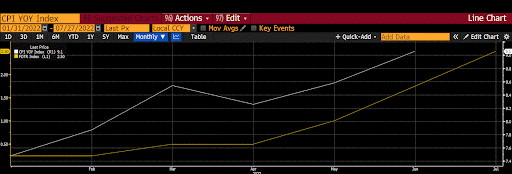
The Fed is increasing their policy rate at the fastest clip in decades, and inflation shows no signs of abating. Some of you econometrics wonks could parse the different components that make up US CPI and point to declines in prices on a forward-looking basis. And you would be right, but you would also be forgetting that this is political economics. Reality is irrelevant, and the number that people care about most is the backwards-looking CPI number. And by this metric, the Fed is failing.
Domestically, the Fed is crashing the economy (it’s in a recession) but inflation still clips more and more purchasing power from the plebes, who are headed to the ballot box in a few months. What to do? What variable should the Fed optimise?
If the Fed optimises for lower inflation, then it must continue raising its policy rate. You could argue the Fed needs to get even more aggressive, as its policy rate of 2.5% at the upper bound is still 6.6% below the latest 9.1% inflation reading.
If the Fed optimises for growth, then it must cut its policy rate and start buying bonds again with printed money. This will reduce the monthly payments for housing, autos, and other durable goods for the 90% of American households who own less than 10% of the financial wealth of the country.
Again, I say in my terrible Mandarin accent – 二选一?
Preach Brotha!
Some things just cannot be uttered by the high clergy at the Fed. For example, they can’t say, “we shall print money to pump asset prices and save the financialised American economy.” It’s too gauche. The Fed has many trigger words in its arsenal that it has trained the investing community to interpret how it wants them to. Words that might sound innocuous to the masses are sweet nothings to the Wall Street Journal editorial board.
With that preamble, let’s dig into what Brotha Powell be preachin’.
The fireworks always happen in the press conference following the meeting decision. The Fed is pretty well aware of what reporters are likely to ask. As a result, their responses are typically well thought out, and we can be sure that Powell was not caught off guard at his most recent presser.
I shall quote from the transcript and annotate with my own colourful vernacular.
JEROME H. POWELL: Good afternoon. My colleagues and I are strongly committed to bringing inflation back down, and we’re moving expeditiously to do so.
Powell is on message. Inflation is the number one priority. Nothing new here.
Recent indicators of spending and production have softened. Growth in consumer spending has slowed significantly, in part reflecting lower real disposable income and tighter financial conditions. Activity in the housing sector has weakened, in part reflecting higher mortgage rates. And after a strong increase in the first quarter, business fixed investment also looks to have declined in the second quarter.
Powell is acknowledging the weak US economy. This confirms the conclusion drawn from the charts posted earlier.
Improvements in labor market conditions have been widespread, including for workers at the lower end of the wage distribution, as well as from African-Americans and Hispanics.
Even the brown folks have jobs– it must be a tight US labour market.
Today’s increase in the target range is the second 75-basis-point increase in as many meetings. While another unusually large increase could be appropriate at our next meeting, that is a decision that will depend on the data we get between now and then.
The Fed is laser-focused on inflation. The interest rate must go up! Nothing new here.
As the stance of monetary policy tightens further, it likely will become appropriate to slow the pace of increases while we assess how our cumulative policy adjustments are affecting the economy and inflation.
Uh oh – maybe inflation isn’t the number one priority. Powell is concerned about how rising rates are impacting the American economy.
That ends the prepared remarks. Now let’s move into the Q&A. This is a pretty long section, and I believe there was only one exchange that mattered. It was with Colby Smith from the Financial Times, and I’m going to walk you through it piece by piece.
Q: Thank you so much for taking our questions. Colby Smith with the Financial Times.
As the committee considers the policy path forward, how will it weigh the expected decline in headline inflation which might come as a result of the drop in commodity prices, against the fact that we are likely to see some persistence in core readings in particular? And given that potential tension and signs of, you know, any kind of activity weakening here, how has the committee’s thinking changed on how far into restrictive territory rates might need to go?
POWELL: So I guess I’d start by saying we’ve been saying we would move expeditiously to get to the range of neutral, and I think we’ve done that now. We’re at 2.25 to 2.5, and that’s right in the range of what we think is neutral. So the question is, how are we thinking about the path forward? So one thing that hasn’t changed is that—won’t change is that our focus is going to continue to be on using our tools to bring demand back into better balance with supply in order to bring inflation back down. That’ll continue to be our overarching focus. We also said that we expect ongoing rate hikes will be appropriate and that we’ll make decisions meeting by meeting.
Let’s pause there. This is a huge statement – according to Powell’s commentary, the Fed believes that, with June CPI at +9.1% and core PCE at 4.5%, a fed funds rate of 2.5% is neutral. That is quite surprising, given 2.5% is definitely below both 9.1% and 4.5% by a fairly substantial amount. That telegraphs that the Fed thinks it has done close to enough to bring inflation down over time, and that doing more will cut the nose of the American economy to spite its face.
Now that they have “done enough”, the Fed will look at the data “meeting by meeting”. The worse the American economic picture becomes, the more likely the Fed is to conclude they have done enough to destroy demand. Bad is good! And by good, I mean for those who hold financial assets.
So what are we going to be looking at? You know, we’ll be looking at the incoming data, as I mentioned, and that’ll start with economic activity. Are we seeing the slowdown that we—the slowdown in economic activity that we think we need, and there is some evidence that we are at this time.
Brotha Powell wants to know how bad the plebes be hurtin’. The economic data is definitely slowing, and given the Fed will absolutely raise rates again in September, the monthly payments will only be going higher as time progresses. We can expect the economic fundamentals to continue to deteriorate. Does this mean the Fed opened the door to a cessation of their monetary tightening programme? Methinks yes.
So we’ll be looking at both and we’ll be looking at them for—at those both, really, for what they’re saying about the outlook rather than just simply for what they say. But we’ll be asking, do we see inflationary pressures declining? Do we see actual readings of inflation coming down?
Powell only cares about whether the rate of change in price rises is slowing. If inflation was at +9.1% but declines to +8.0%, in the Fed’s worldview, inflation is declining. I should remind the Pro Tempore that prices are still rising – just at a slower pace. Nevermind that, though. Let’s not be logical about this– we just want him to turn the money printer back on.
So in light of all that data, the question we’ll be asking is whether the stance of policy we have is sufficiently restrictive to bring inflation back down to our 2 percent target. And it’s also worth noting that these rate hikes have been large and they’ve come quickly, and it’s likely that their full effect has not been felt by the economy. So there’s probably some additional tightening—significant additional tightening in the pipeline.
Powell believes that going from 0% to 2.5% in under six months was extremely aggressive, even with YoY inflation surging at 9.1%. Ok, I’ll take it. We can see the Fed desperately wants to stop raising rates. They can justify a pause because they went SO hard SO fast with rate hikes that the full effects will be felt well into the future. That allows him to then pause because the Fed can let its prior actions percolate through the economy. LET’S FUCKING GO!
And finally…
So that’s how we’re thinking about it. As I mentioned, as it relates to September, I said that another unusually large increase could be appropriate. But that’s not a decision we’re making now. It’s one that we’ll make based on the data we see, and we’re going to be making decisions meeting by meeting. We think it’s time to just go to a meeting by meeting basis and not provide, you know, the kind of clear guidance that we had provided on the way to neutral.
A large rate hike is assured at the September meeting. The market is currently pricing in a 50bps hike in September. What is now in play is a subsequent pause at the November meeting. That is what the market cares about. And with short-term rates at 3% by the end of September, those monthly payments are going to be awfully unaffordable for the American plebe.
Market Reaction (Data from Bloomberg)
|
Asset |
26 July 2022 |
29 July 2022 |
% Change |
|
Nasdaq 100 (NQ1) |
12112.5 |
12971.5 |
7.09% |
|
S&P 500 (ES1) |
3923.25 |
4133.5 |
5.36% |
|
Bitcoin / USD |
20985.62 |
23951.94 |
14.14% |
|
Ether / USD |
1379.57 |
1716.86 |
24.45% |
My macro risky asset indicators all rallied after the Fed meeting, and held the gains into the Friday close. While that is impressive, we need some context. Let’s take a look at how risky assets performed before and after both the June 15 and May 4 meetings.
|
Asset |
14 June 2022 |
17 June 2022 |
% Change |
|
Nasdaq 100 (NQ1) |
11314.25 |
11130.39 |
-1.63% |
|
S&P 500 (ES1) |
3736.75 |
3663.76 |
-1.95% |
|
Bitcoin / USD |
21966.38 |
20630.54 |
-6.08% |
|
Ether / USD |
1168.56 |
1081 |
-7.49% |
|
Asset |
3 May 2022 |
6 May 2022 |
% Change |
|
Nasdaq 100 (NQ1) |
13087.5 |
12695.75 |
-2.99% |
|
S&P 500 (ES1) |
4169.25 |
4119.5 |
-1.19% |
|
Bitcoin / USD |
37784.82 |
36077.29 |
-4.52% |
|
Ether / USD |
2786.19 |
2687.92 |
-3.53% |
In both the June and July meetings, the Fed raised rates by 0.75%, and the expectations for the amount the Fed would raise at the September meeting barely budged. The September 30, 2022 fed funds futures contract was 97.53 on June 17 and 97.495 on July 27. The market is clearly discounting a fed funds rate cut well into the future.
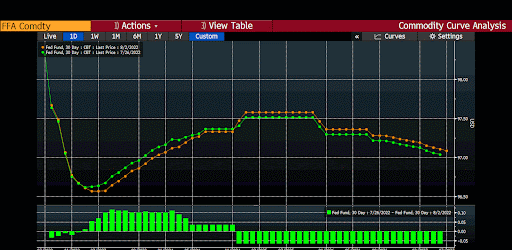 If we take a look at the change in the fed funds futures curve from July 26 (a day before the Fed announcement) vs. August 2, there isn’t much difference. If the curve shifts higher, it means the market expects rates to fall, and vice versa. The effective rate is 100 minus the futures price.
To understand whether the market is starting to price in a relaxation of the Fed’s monetary tightening campaign, let’s focus on the expectations for the fed funds rate as of December 2022.
Risk markets continue to hold their post-Fed meeting gains, but forward-looking money markets derivatives point to no change. Who is right? I believe that as the economic data continues to worsen and the increasing price of credit further restricts financial activity, the negative growth story will trump persistent high inflation. Powell said the Fed had gotten to neutral, and now they need to observe the effects on the broader economy. If you want the Fed to turn the taps back on, bad is good! Furthermore, I trust in Bitcoin’s ability to be a forward indicator of change to the availability of USD liquidity – and its recent jump in price suggests the Fed will be getting a bit more loosey goosey with their monetary policy in the (relatively) near future. Let’s explore what that timing might realistically look like.
The Schedule
|
Fed Key Dates 2022 |
|
|
Jackson Hole |
August 25-27 |
|
Policy Meeting |
September 20-21 |
|
Policy Meeting |
November 1-2 |
|
Mid-Term US Elections |
November 8 |
|
Policy Meeting |
December 13-14 |
Historically, past Fed chairs have announced large policy shifts at the Jackson Hole symposium. If US economic data continues deteriorating rapidly, the Powell pivot could be announced at this jamboree.
The market’s expectations of the policy rate change at the September meeting is baked in. However, between now and then, the Fed will have two additional CPI data points (July CPI, released August 10th, and August CPI, released September 13th). I’m no data sleuth, but it is entirely likely that the rate of price rises slows by the second reading. That would give Powell the justification he needs to backslide into easing monetary conditions.
Given that the November meeting is mere days away from an election, it would be quite bad form for the Fed to dramatically alter its policy stance. Instead, the Fed will likely attempt to be as bland as possible so as not to distract from the ongoing poli-tainment.
Given the data, we are almost assured a 0.5% to 0.75% rate hike at the September meeting. Of course, the economic data could disappoint so badly that the Fed pauses in September, but I’m not of that view. This leaves the December meeting as THE defining meeting for the remainder of 2022. We are trading that meeting. I fully expect the steadily climbing fed funds rate to wreak absolute carnage upon the average American from now until the December meeting. The economic trainwreck will be so obvious that even the spin doctors employed by the ruling party will have to admit the damage is real.
With the election concluded, the Fed will have a free political hand to get back to business – the business of reducing Americans’ monthly payments by loosening monetary policy. While the top 10% disproportionately benefit from a rise in financial asset prices, given that every facet of American life is financed, the plebes also need cheap rates to afford their lifestyles. Everyone is hooked on cheap money provided by the Federal Reserve.
In Position
We are now in position. The forward expectations of Fed policy point to easing. Risky asset markets have therefore most likely bottomed, and will now trade on a future of cheaper and more plentiful US dollars.
But what shot should we hit?
Outperform the Denominator
In a world financial system priced in USD terms, the relevant metric to observe when picking an asset to preserve energy purchasing power is the asset value deflated by the rise of the Fed’s balance sheet. I went over this in detail in “Grow Up or Blow Up”.
To recap, let’s observe how stonks (Nasdaq 100 and S&P 500), US real estate (Case Shiller home price index), and Bitcoin – each divided by the Fed’s balance sheet – have performed from the beginning of 2008 until the present.
Nasdaq 100 (white), S&P 500 (yellow), US Housing Prices (green), Bitcoin (magenta)
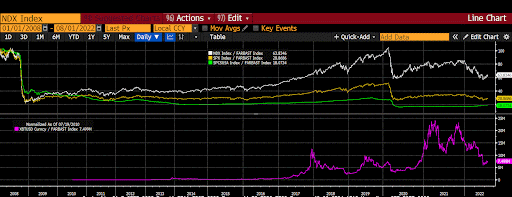
I computed the deflated asset values, then normalised at 100 starting with 2008. A number below 100 means the asset underperformed the growth in the Fed’s balance sheet, and a number above 100 means the asset outperformed. As you can see, in order to actually have a legible chart, I had to put Bitcoin in a separate panel due to its significant outperformance. Stonks and US real estate each represent trillions of dollars worth of value, and neither outperformed.
I am confident that my tightest shot will be Bitcoin or some other cryptocurrency.
This is not to say that all other non-crypto risky assets won’t also go up markedly in value. But if you subscribe to my theory about the mathematical certainty of Yield Curve Control in Japan, Europe, and the US (see here and here), then you must believe the aggregate fiat balance sheet of the major central banks will rapidly increase by tens of trillions of dollars. As indicated above, stonks and real estate have not been able to outperform the addition of over $8 trillion in USD assets to the Fed’s balance sheet since 2008. If they couldn’t do it over the last decade, why would you think they’d do it over this one?
Five Ducking Digits
My shot will be one forged by Archangel Vitalik. I shall hit my shot with a racquet tempered with Ether.
Will the Ethereum network update to Proof-of-Stake (PoS) on schedule or not? That is the only question you must ask yourself. Before I give a TL;DR on the reasons why the Ethereum merge is extremely bullish for Ether’s price and has not yet been priced into the market, let me explain why I am more confident today than ever before that the merge will actually occur.
Readers who have been following my career as an essayist will remember I shat all over the Ethereum pre-sale. I said it was worthless. I was wrong. Please forgive me, o lord!
In 2018, I penned an essay titled “Ether, A Double Digit Shitcoin”, in which I forecast the price of Ether would dive below $100. And I was right! For a short while…
I became a believer in 2020, when I saw a chart posted somewhere depicting how the Ether market cap was less than the total market cap of all the dApps it supported. That was my cue to go long and strong, and I have not been disappointed. I fervently believe that DeFi offers a credible alternative to the current financial system – and for now, Ethereum is poised to power the world’s financial computer.
Since 2015, Vitalik has talked about the need to eventually move to a PoS consensus mechanism. Many in the community believed this was a “Waiting for Godot” type situation. It’s coming … it’s coming … soon, just you wait … really, I’m serious!
I do not possess the technical skills to evaluate whether or not the Ethereum core developers can pull it off or not, and I certainly can’t offer an opinion on whether their launch estimations are credible. But while I and most of you reading this cannot make these determinations, there is one group of Ethereum network stakeholders who absolutely can handicap the likelihood of success. That is the current crop of Ethereum miners.
Miners, who spent billions of dollars on GPU graphics cards and associated CAPEX, can only earn revenue under a Proof-of-Work (PoW) system. Kraken wrote an excellent blog post explaining the difference between PoW and PoS systems. When/if the merge occurs and Ethereum transitions from PoW to PoS, Ethereum miners’ revenue will drop to nothing and their equipment and facilities will become practically worthless, unless they can find another chain with value to mine that provides the same marginal revenue as mining on Ethereum pre-merge. I highly doubt this is possible, given Ether is the second largest cryptocurrency by market cap and there isn’t another PoW blockchain with a multi-hundred billion dollar market cap that can be mined using GPUs. So, when the miners start becoming vocal about the negative impacts of the merge, it’s fair to surmise that the merge is an actual possibility.

Chandler is aligned with the Chinese Ethereum mining community. He is quite an impressive individual, and I have known him for many years. I do not doubt his resolve to do this.
After I read this tweet, I pinged some of my other contacts in the Chinese mining community. I asked them if this potential airdrop or hard fork to form an Ethereum chain based on PoW is real. One guy said absolutely, and added me to a WeChat group where serious individuals are discussing the best way to achieve this reality. Another friend said this is absolutely going down, and Chandler had already reached out to him for his support.
Again, after the merge, the miners’ machines will become worthless overnight unless they can mine on another chain that has value. I have serious doubts about whether an ETH PoW chain has long-term viability, but for now let’s just assume it will exist at a significantly non-zero market cap for a number of months. The more important point is that they would not embark on this journey and spend valuable political capital within the community if they did not believe the merge would happen on schedule(ish).
So if the merge will most likely happen sometime in Q3 of this year, or at the latest, Q4, then the question is – has the market already priced in the merge?
The Amber Group published an excellent piece discussing all things merge. Here are the relevant takeaways:
- The market expects the merge to happen on or around 19 September 2022.
- The ETH issuance per block will be reduced by 90% post merge, which renders ETH a deflationary currency.
- ETH staked on the beacon chain will remain locked for another 6 to 12 months.
Amber argues the merge is akin to a “triple-halving”:
On the supply side, Ethereum is currently incentivizing both miners (under PoW) and validators (under PoS). Seignorage is paid to miners to produce new blocks at 2ETH per block, and rewards are also being distributed to validators on the Beacon Chain. After the Merge, rewards to miners will cease, reducing ETH’s issuance rate by ~90%. This is why the Merge is also colloquially termed the “triple halving” — a nod to Bitcoin’s halving cycles.
Demand for Ether is also expected to increase after the Merge due to a number of factors. First, staking rewards for validators will immediately increase. Validators will receive transaction tips that are currently earned by PoW miners, potentially boosting APRs by ~2–4%. Furthermore, they will also begin to earn MEV (maximal extractable value) due to their ability to reorder transactions. Researchers at Flashbots, an R&D organization that studies the emergent behaviors of MEV, suggest that validator yields could increase an additional 60% due to MEV (assuming 8M staked ETH). Therefore, if the Merge happened today, validators could expect to earn a total of ~8–12% APR due to all the factors mentioned above.
Most, if not all, of this information hasn’t changed in many months. What changed was the credit-driven collapse in crypto prices. Thank you, Luna / TerraUSD and Three Arrows. This market dislocation created many forced sellers, and many hedge funds who went BIG into DeFi got third-degree burns. Any and every thing related to DeFi got puked.
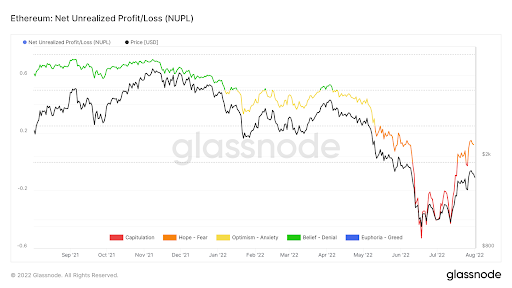
This informative chart from glassnode shows Ethereum’s Net Unrealised Profit / Loss (NUPL). By timestamping the creation of new UTXO’s, we can determine which addresses are in an unrealised profit or loss. Here is glassnode’s explanation of the concept (just replace Bitcoin with Ethereum):
If all bitcoins were sold today, how much would investors stand to gain or lose?
Or to put it differently: How much of Bitcoin’s circulating supply is at any given point in time in profit or loss — and to what extent?
The takeaway here is that a large portion of traders got rickety REKT during the recent downturn. Margin calls forced otherwise huge DeFi bulls to cower in the corner, hoping to salvage some remaining value from their overleveraged portfolios. Most of those who held are sitting on unrealised losses, as a large portion of the folks responsible for the influx of new capital this cycle – a lot of it “institutional” – paid the highs and are now underwater. But it’s a “long-term” investment, right?
TL;DR: Given all of the forced selling that occurred during the market drop and the poor financial positions that most crypto investors have been left in, the merge does not appear to be priced in– and we have an amazing opportunity to increase Ether positions at very attractive levels.
So now that the dust has settled, the remaining faithful among us – either as hodlers of Ether or with filthy fiat to spend – must determine how significant we think the price impact of the merge will be based on expected market conditions and/or other contributing factors.
Let me share a simple example to illustrate why I believe the merge will have an incredibly powerful impact on the price of ETH.
Many of you trade stonks and understand at a basic level that a stonk is a claim on future profits of a company. But, a company does not pay you a dividend in additional shares of stonk – it pays you in fiat currency. And furthermore, to use the services of a given company, you do not pay with the company’s own stonk, but with fiat currency.
For Ethereum, the “dividends” – or earnings you receive as a staker – are paid in Ether, AND you must pay in Ether to use the service. Stakers must also stake their Ether in order to earn “dividends”, requiring them to lock up their funds and effectively remove them from the market. And the more Ether that stakers stake, the more “dividends” they earn. So, it’s probably safe to assume that most stakers will take the Ether “dividends” they earn and lock those up too. Combine that with the impact of users needing to pay Ether fees to use Ethereum (which are removed from circulation), and the fact that the rate at which Ether is issued per year will be reduced by ~90% under the new PoS model, and we will be looking at a rapidly reducing supply of Ether. And the more the network is used, the more of the network’s own currency must be spent to use it – so the Ether taken out of circulation will only increase as the network grows in popularity (assuming it’s providing a useful service). Of course, it’s important to note that the per-transaction fees paid by users are expected to drop under the new PoS model, but even so, when you take all of these factors together, they should still drive the price of Ether up exponentially.
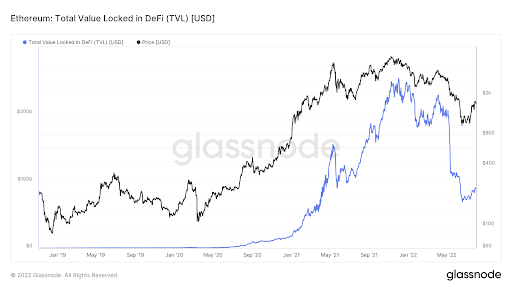
A good proxy for usage is the Total Value Locked (TVL) in DeFi applications (i.e., the amount of funds that users have parked or “staked” on DeFi platforms, for which they are receiving yields in return). I believe DeFi will offer a credible alternative system to the financial cartel of trust that we currently pay trillions of dollars per year to in economic rents. That is what the above chart displays. As you can see, TVL screamed higher post-2020. The applications that use this locked collateral pay ETH fees to the network. The bigger DeFi grows, the more deflationary ETH becomes. This becomes a problem at the extreme, but we aren’t anywhere close to that situation yet. You can read, “Yes … I Read the Whitepaper” for a discussion on this.
Let’s run through my hypothesis once more before we move on.
- I am confident the merge will happen by the end of the year due to the increased noise made by Ethereum miners, who will likely lose a significant chunk – if not all – of their income in a PoS world.
- The recent market rout broke the souls of the “Zhu-percycle” bulls who were big on Ethereum and DeFi this cycle, turning them into a horde of indiscriminate sellers.
- The “buy the rumour, sell the news” phenomenon post-merge will not occur. Anyone who might sell has likely already sold due to the intense downward price movement over the past month.
- The merge means that Ether becomes a deflationary currency, and usage is forecasted to continue growing as DeFi gains popularity– increasing the rate of deflation.
- Although there are other Layer-1 smart contract network competitors, many of them already feature some version of a PoS consensus algorithm. Ether is the only major cryptocurrency currently transitioning from PoW to a PoS.
The last point is extremely important. This change is a one-time event. There will never be another investing setup like what we’re seeing today. That is why my shot shall ring true, powered by Ether.
Expected Value Calculation
This is the most important section of this essay, because even if my arguments are sound and you come away from them convinced, there is a large, non-zero chance I am wrong. In light of that, let’s quickly walk through the price predictions for all potential macro and merge outcome combinations.
Unless otherwise specified, the prices I cite in this section are from Bloomberg. There will be some discrepancy between your favourite spot exchanges and the cross rates on Bloomberg, but I’m doing this to be consistent.
Scenario 1: Fed Pivot + Successful Ethereum Merge (i.e., what I am speculating will happen, and the best case scenario for ETH)
In November 2021, the Fed was printing money, shitcoins were surging, and attention started shifting to the bullish narrative surrounding an upcoming 2022 Ethereum merge. Therefore, I will use $5,000, the psychological barrier Ether fell just short of at that time, as my price target for this scenario. I believe this is a conservative estimate, because the structural changes to the demand/supply dynamic will never be fully priced in a priori– just like how the Bitcoin halvings continuously produce positive returns, even though we know well in advance when they will occur.
Scenario 2: No Fed Pivot + Successful Ethereum Merge
From the deepest, darkest depths of the Three Arrows-initiated forced liquidation of many of the preeminent crypto lending institutions and hedge funds, Ether has rallied from a low of around $1,081 to $1,380 – a close to 30% return in a matter of weeks. From the July 27 Fed meeting to the July 29 Friday close, Ether was +25% in absolute terms, and +9% vs. Bitcoin.
If the Fed is not turning the money printer back on, then the base case is a return to the levels from before the market started to contemplate a Fed pivot. To be conservative, let’s assume the ETH price returns to the June 17 market low ($1,081), but also retains any price movement it experienced from the June 17 low to July 26 (the day before the Fed pivot was put on the table) that we can attribute strictly to expectations of a successful merge. In order to isolate the movement in ETH’s price over that time frame that was driven solely by merge expectations, let’s assume that any recent outperformance of ETH vs. BTC has been driven entirely by expectations for the impact of the merge. This will allow me to isolate the effect of speculation regarding the merge’s timing and outcome from the effects of USD liquidity on the broader market.
ETH’s value increased increased 25.46% vs. BTC from June 17 to July 26 – so if the Fed pivot gets taken off the table, we can assume that the price would drop to $1,081 (the June 17 low) * 1.2546, which comes out to $1,356.
Now, we need to add on the expected price impact of a successful merge. As I mentioned earlier, the merge is expected to drive a “triple-halving” event due to the structural impact it will have on the Ethereum network. To predict how this might affect Ether’s price, we can look at how Bitcoin has performed between its halving dates. The below table shows the price appreciation that has occurred between each Bitcoin halving date.
|
28 November 2012 |
9 July 2016 |
11 May 2020 |
8/4/2022 (Current) |
|
|
Price |
12.3 |
657.32 |
8599.78 |
22589 |
|
% Change |
5244.07% |
1208.31% |
162.67% |
Bitcoin is decentralised money. Ethereum is decentralised computing power. If Bitcoin has always gone up post-halving, it is reasonable to assume Ether will as well. Therefore, if we take the least significant post-halving price rise of 163%, and apply that to $1,356, then we arrive at an expected value of $3,562.
Please note: the 163% post-merge price performance is extremely conservative as the total Bitcoin supply continued to increase each block after every halving, whereas Ethereum’s supply post-merge, given current usage trends, should contract every single block.
Scenario 3: No Fed Pivot + Unsuccessful Ethereum Merge
No free money and no assistance from Archangel Vitalik takes us back to the dark ages. That would be the recent low of $1,081 – which is my price prediction for this scenario.
Scenario 4: Fed Pivot + Unsuccessful Ethereum Merge
If the merge fails or is postponed, the Ethereum network will still work just as it does today. Many might be severely disappointed, but the value of Ether won’t drop to zero. Solana, the 9th largest shitcoin – with a market cap of $13.5 billion – has ceased working for many hours multiple times over the past 12 months, and it is still worth a lot more than zero. Ethereum will be just fine if the merge doesn’t happen on schedule.
To calculate the impact this scenario will have on the price of ETH, let’s use BTC/USD price performance from June 17 to July 26 as liquidity beta to determine what the price of ETH would have before before a potential Fed pivot was on the table, and without merge-related excitement driving the price up – while still including any price movement we believe was driven strictly by recent USD liquidity conditions.
|
17 June 2022 |
26 July 2022 |
Liquidity Beta |
|
|
BTC/USD |
$20,630.54 |
$20,985.62 |
1.72% |
|
ETH/USD |
$1,081.00 |
||
|
ETH/USD w/ Liquidity Beta |
$1,081.00 *1.0172= |
From June 17 to July 26, BTC increased 1.72% against USD. So, we can estimate that the price of ETH would have also increased by 1.72% over that time frame in the absence of merge-related excitement – because again, we’re assuming the merge is the only factor driving ETH’s outperformance vs. BTC. A failed or postponed merge would thus take us back to $1,081 (the July 17 ETH low) * Liquidity Beta (1.0172), or $1,099. But in this scenario, we also get to experience the euphoria of more printed money. DeFi will continue to gain ground on TradFi. And if the past is any indicator, Ether will suck filthy fiat into its orbit as the Fed expands the money supply once more. Ethereum rose almost 10x from the March 2020 lows when the Fed expanded USD global liquidity by 25% in the span of one year. To be conservative, I’ll predict that Ether only rallies back to the current levels of $1,600.
The Expected Value Matrix
I assigned an even probability to the four outcomes. (Obviously, you can play around with this basic model based on your opinions, but this is a simple starting point). I then calculated the return from the current levels to the expected price for each scenario, weighted those expected returns by their probability, and averaged all of them together– bringing us to the expected value.
|
Current ETH Price |
$1,600 |
||
|
Price |
% Return |
Probability |
|
|
Successful Merge + Fed Pivot |
$5,000 |
212.50% |
25% |
|
Scenario 1 |
$3,562 |
122.63% |
25% |
|
Scenario 2 |
$1,099 |
-31.31% |
25% |
|
Scenario 3 |
$1,600 |
0.00% |
25% |
|
Expected Value |
$2,815 |
75.95% |
With an expected future value that is 76% higher than today, our March 31 ETH/USD forward price is $1,600 (current spot price) * 1.7595, or $2,815.
I believe I’m being extremely cautious with the outcome of Scenario 3, so this is a highly conservative estimate. And given the expected return is significantly above 0%, I can confidently deploy fiat into Ether.
Execution
Let’s evaluate our options for participating in this opportunity.
Spot / Physical Ether
This is the most straightforward option. If ETH is currently trading 76% cheaper vs. my model, then I am willing to sell fiat and purchase Ether today. I get an added bonus because I will receive an equal amount of tokens from any PoW Ether fork that appears. These ETH_PoW coins can be sold as soon as a centralised spot exchange lists any ETH_PoW pair.
Today (August 4), the Deribit 31 March 2023 ETH/USD futures contract traded at $1,587. My model futures price is $2,815, and therefore the futures market appears to be 44% UNDERVALUED. Therefore, if I wanted to express my trade using leveraged futures contracts, I should buy these contracts.
ETH/USD Call Options
Given our model says the fair value of the March 31 futures contract is $2,815, that is my at-the-money forward for the purposes of pricing an option. Therefore, I should purchase a call option with a $2,800 strike.
On August 4, the Deribit March 31 $2,800 strike ETH/USD call offer price was 0.141 ETH. Each contract is worth 1 ETH. Using their options pricing model the important greeks are as follows:
Delta: 0.37
Implied Vol: 98.3%
If you don’t know what these mean, you shouldn’t be trading options.
I want to take a bit more risk on the timing of the merge and on the potential upside, so I bought Dec 2022 options contracts with a $3,000 strike. The shorter time expiry means I pay less time value, which is expensive given the high level of implied volatility. My strike is further out of the money and that cheapens the option, but on the flip side, I will pay more for volatility due to the smile of the term structure.
As I map out my trading strategy going into the merge, I will most likely purchase more spot ETH and engage in other financing trades to maximise my opportunity to capitalise on market mispricings. There shall be many, just as there were during the 2017 Bitcoin chain splits.
The End
Haters gonna hate
But my portfolio ‘bout to appreciate
1k, 2k, 3k, 4k
5k, 6k, 7k, 8k,
Ten Thousand American Dollars, I say!
MAX BIDDING Ether
MAX SELLING Fiat
Inshallah you apostate
Related
The post appeared first on Blog BitMex


