Abstract: We take a second look at the fee differences between actual Bitcoin blocks produced by miners and the fees one may expect, based on a local Bitcoin Core node. We explore the concept of out of band fees as a potential explanation for these differences. We have detected evidence that the recent apparent increase in these differences may not be as significant as some people may suspect and the evidence for increases in out of band fees may therefore be limited.
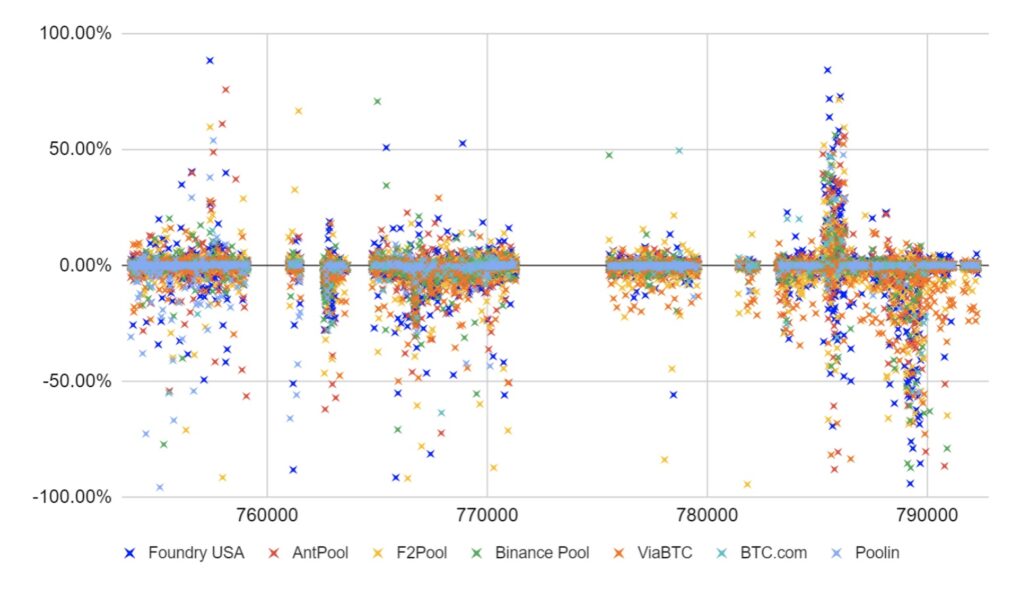
Miner fees by pool – Actual blocks vs block templates (Differences) – Percentage of total fees

Note: Positive number indicates actual block fees are higher than the block template fees. Block template data is from one Bitcoin node run by Sjors Provoost. Gaps are the periods the node was not generating templates. The chart is constructed by Google Sheets in layers, with Poolin at the top and Foundry USA at the bottom.
Overview
This piece should be considered an update to our January 2021 piece entitled “Bitcoin Miner Transaction Fee Gathering Capability”. The original piece was inspired by Marathon mining pool announcing a policy of transaction censorship (The pool no longer has this policy). This new piece, which collects the same type of data over a more recent period, is inspired by recent comments from analysts, which indicate that miners may somehow be making more money in fees than one would expect, given the transactions available in the memory pool.
Out of band fees
Fees could be paid to miners “out of band”, which means the fees are not paid through the normal open memory pool system. This terminology originates from telecommunications and refers to messages being sent outside the primary communication channel. One example of this are “transaction accelerator services”, which have been around for many years in Bitcoin. These are services where users can pay a fee to a company, along with a Bitcoin TXID. The company would then pass on some of this payment to mining pools who sign up for this service. The transaction may then get mined faster and the fee would be paid “out of band”. Another example is an ordinals inscriber directly providing their very large transaction to the miner, since the transaction will not be broadcast by Bitcoin Core as its non-standard.
If out of band fees become very popular, this is potentially bad from the perspective of Bitcoin’s decentralisation and therefore censorship resistance. Firstly, miners will presumably need to sign up for a centralised service or have a relationship with individual users. This is a barrier to entry in order to get into the mining industry and could contribute to centralising mining. It is also a negative from a user perspective too, users would need to deal with some particular entities to get their transactions in the blockchain, entities which could, in theory, censor transactions. On the other hand, there may be other decentralised mechanisms to get a non-standard transaction to a miner without using the standard mempool system.
Another problem with sending transactions directly to a miner is that it slows down block propagation between mining pools. This is because compact blocks don’t work efficiently when intermediate nodes don’t know about a transaction. Slow propagation creates a centralisation pressure. This is less of a problem if the transaction is standard and pays enough fee to end up in all mempools, and the out of band payment is only used to top up the fee for faster inclusion.
One could argue that out of band fees should not exist. The memory pool is already supposed to be an open competitive fee marketplace and therefore out of band fees should not be required. However, unfortunately it does not always work like that. Out of band fees could be popular for the following reasons:
- Some users may not have sufficient expertise to understand the memory pool and market fee rates. At the same time they may not know how to set fees appropriately.
- Wallet fee management systems may not be sufficiently user friendly.
- Some wallets systems may not support all the fee management features such as custom fee rates, RBF and CPFP.
- Businesses like exchanges, may want to accelerate user deposits. They may not want to use CPFP, since the funds could be sent to a cold wallet and therefore out of band fees could be necessary for security reasons.
- An exchange may be unwilling to use RBF for withdrawals, especially batched withdrawals, as clients could depend on the TXID not changing and may have already spent the unconfirmed outputs.
- A user may be sending a transaction without change and may have no spare inputs and therefore cannot conduct an RBF fee increase.
- Some kind of smart contract could be involved, such as lightning non-cooperative closure transactions, which can limit the ability of users to increase fees in certain scenarios.
- One of the quirks or buggy Bitcoin Core fee logic could come into play, such as an RBF fee increase that actually lowers the overall cluster fee rate due to new transaction ancestors. Another example is that users may be unable to add a CPFP transaction, due to some cluster limits being breached.
- The transactions could be non-standard and therefore not broadcastable to the memory pool.
Due to the numerous reasons above, it seems highly unlikely that out of band fees will ever be totally eliminated. They therefore may be inevitable and unstoppable. However, there is certainly a lot of work to do with respect to education, wallet development and Bitcoin Core transaction selection policy, in order to minimise the potential opportunity for out of band fees.
Block Template Data
Partly inspired by our January 2021 post, the website miningpool.observer was launched. Among other things, such as attempts to detect transaction censorship, for every block produced by the miners the website displays a candidate block from its local instance of Bitcoin Core, using getblocktemplate. One key metric to analyse is the fee difference. Which block has more fees, the local Bitcoin Core node candidate block or the actual mined block?
At some recent Bitcoin meetups, some in the technical community were indicating they had noticed a large uptick in these differences in the last few weeks. In particular, positive differences, when actual blocks have more fees than the miningpool.observer template blocks. This could indicate that the actual miners were receiving transactions with higher fees “out of band”. These fees could be in the transactions, but the transactions may never have been broadcast to the memory pool. This was noticed anecdotally, just by browsing the website and as far as we are aware, no concrete data has been shown.
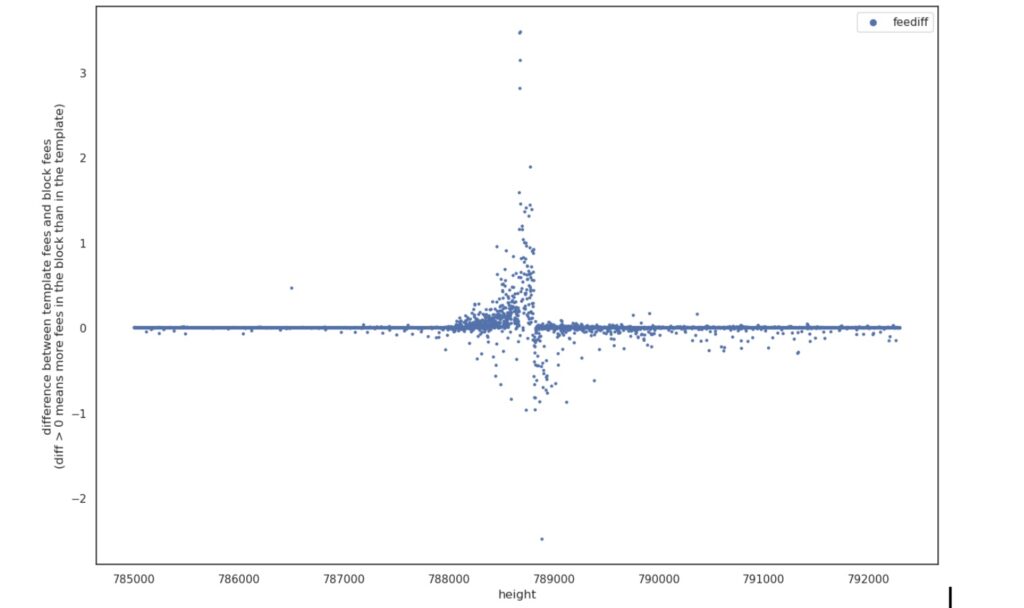
However, unfortunately, it is possible that the miningpool.observer node was impacted by this bug, which may have reduced the ability to produce effective candidate blocks. This issue may partly explain the recent uptick in positive differences. The chart below, Figure 1, was provided by the administrator of miningpool.observer and shows the recent differences. The chart shows the differences are largely positive and growing, before reaching an inflection point and turning mostly negative. This is when the node was restarted and therefore a bug may have caused this pattern, rather than any fundamentals to do with mining economics.
Figure 1 – Miner fees – Actual blocks vs block templates (Differences) – BTC

Note: Data from miningpool.observer
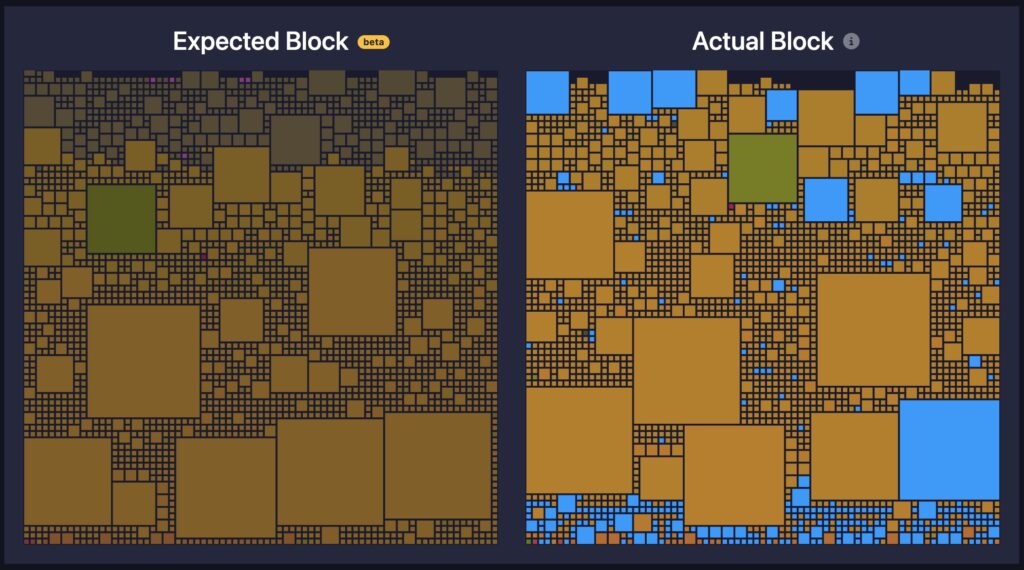
Mempool.space has also recently added this same feature to their website, in a characteristically beautifully implemented feature called “Audit”.

Again, some commented anecdotally that actual blocks recently started to contain more fees than the mempool.space blocks, an uptick in positive differences. However, this spike may also be due to a bug, which is now fixed.
Differences Dataset
There is a node which regularly produces candidate blocks, which we do not think was significantly impacted by a bug of this kind where we have the data. At least we hope the impact of these kinds of bugs is minimal. The node was not generating template blocks for some periods, which explains the gaps in the below charts. The data below, in Figure 2, shows that there was a large recent uptick in differences, this time in the negative direction (i.e. candidate blocks have more fees than actual blocks). This occurs just before block 790,000. This negative direction is more consistent with historical norms, for instance our January 2021 piece largely consisted of negative differences on average. However, large negative differences could also indicate out of band fees, this time fees that are “fully” out of band, i.e. not included in the transactions. These fees could be paid to the miners by lightning payments, credit card payments or monthly US$ wire transfers for example. On the other hand, perhaps a more likely cause of the differences is the memory pools of the miners struggling to keep up with the network in the recent period.
Figure 2 – Miner fees – Actual blocks vs block templates (Differences) – BTC
Note: Positive number indicates actual block fees are higher than the block template fees. Block template data from one Bitcoin node run by Sjors Provoost. Gaps are the periods the node was not generating templates.
However, as Figure 3 below shows, Bitcoin fees have increased rapidly in the same recent period, perhaps due to Ordinals and “BRC-20” tokens boosting demand for block space. This same activity may have increased the size of some memory pools, which could have made it harder for some mining pools to keep up.
Figure 3 – Bitcoin fees per block (40 block rolling average) – BTC
Source: BitMEX Research
In Figure 4 below, the data has been adjusted to strip out the impact of these higher fees. We did this by dividing the differences by the total fees in the actual block. With Figure 4, it is much harder to argue there has been a recent uptick in differences (in either direction). Therefore, there is limited evidence of an increase in “out of band” fees. However, one can judge for one’s self if there is a noticeable pickup in differences around block 790,000. It does look like turbulence may have marginally increased in the period.
Figure 4 – Miner fees – Actual blocks vs block templates (Differences) – Percentage of total fees
Note: Positive number indicates actual block fees are higher than the block template fees. Block template data from one Bitcoin node run by Sjors Provoost. Gaps are the periods the node was not generating templates.
Figure 5 is a repeat of Figure 4 above, except each major mining pool now has its own colour. There does not appear to be any noticeable variations in the difference data by mining pool, at this point in time.
Figure 5 – Miner fees by pool – Actual blocks vs block templates – Percentage of total fees
Note: Positive number indicates actual block fees are higher than the block template fees. Block template data is from one Bitcoin node run by Sjors Provoost. Gaps are the periods the node was not generating templates. The chart is constructed by Google Sheets in layers, with Poolin at the top and Foundry USA at the bottom.
Figure 6 indicates that every major mining pool is slightly less effective at selecting transactions than our local node. Performance has been reasonably similar across all the major pools. The exception to this is that Poolin appears to be the worst performer, by a considerable margin. However, this only relates to 483 blocks and the dataset is probably too small to infer any strong conclusions. A couple of blocks, such as 755749 contributed significantly to this very “low score”, and these large differences could be explained by SPV mining, not hidden out of band fees.
Figure 6 – Miner fees by pool – Actual blocks vs block templates – Percentage of total fees
Note: Positive number indicates actual block fees are higher than the block template fees. Block template data from one Bitcoin node run by Sjors Provoost. 38,000 block period ending 792,298. Period includes gaps.
Conclusion
The evidence we have suggests there has been no recent significant increase in these differences (Actual fees vs template fees), when compared to the higher market fee rates. There is also no evidence we have found which suggests that out of band fee payments are currently a major cause for concern. However, fees have increased recently, as have memory pool sizes. The network is certainly being tested, at least to some extent.
Related
The post appeared first on Blog BitMex


