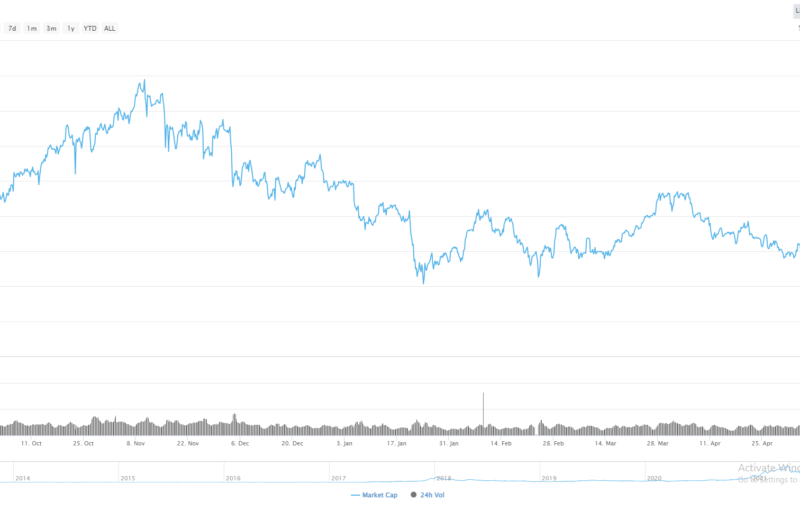
- Monero is heavily bearish in the short-term, with any moves higher in the cryptocurrency currently being heavily sold
- A bearish head and shoulders pattern on the four-hour time frame suggest that the XMR / USD pair could drop towards the $58.00 level
The technicals for Monero are mostly bearish at the moment, with a number of patterns suggesting that the XMR / USD pair remains vulnerable to further losses while trading below the $88.00 level. In the near-term, a breakout from the $74.50 to $88.00 levels will almost certainly determine the next strong directional move in the cryptocurrency.
After peaking around the $120.00 level on June 23rd this year Monero has subsequently seen a bearish shift, with the cryptocurrency sold hard on rallies back towards the $100.00 level. The four-hour time frame now depicts a complex bearish head and shoulders pattern in play, with the $58.00 level the overall downside target.
The daily time frame also shows that major trendline support is located at the $58.00 level, which further underscores the importance of this key technical area which may soon start to come into focus.
The XMR / USD pair’s 200-day moving average is currently located at the $74.50 level, which is a key technical area that bulls have been defending since the rapid decline from the $120.00 level. We should expect technical selling to increase if we see a sustained breach of the 200-day moving average over the coming sessions.
According to the latest sentiment data from TheTIE.io, the short-term sentiment towards Monero is currently slightly positive, at 51.10 %, while the overall long-term sentiment towards the cryptocurrency is bearish, at 29.00%.
 XMR / USD H4 Chart by TradingView
Upside Potential
The four-hour time frame is showing that if bulls break above the $91.00 level, the August 8th swing-high, around the $98.00 level will offer the strongest form of technical resistance. The mentioned time frame currently shows four lower price highs, making a break above the most recent swing-high, at $91.00, technically very important.
The daily time frame highlights that the XMR / USD is trading below the 50-day moving average, at $87.00, but above its 200-day moving average, which is found at the $74.50 level.
 XMR / USD Daily Chart by TradingView
Downside Potential
The downside potential for the XMR / USD pair is likely to accelerate if we see the $74.50 support level broken, leaving the July 17th swing-low, at $71.20, the most important support area to watch prior to the $65.00 level.
The RSI indicator on the daily time is trading around $48.00, and highlights that the XMR / USD pair is still not yet oversold and certainly has plenty of downside potential if we start to see sustained weakness below the $74.50 level.
Summary
Monero has significant downside potential if we start to see price break below the $74.50 level. The bearish pattern on the four-hour time frame is pointing to a possible move toward the $58.00 level.
Overall, the short-term technicals are still very bearish, traders should be on guard for a potential medium-term bearish shift, if we see a move below the XMR / USD pair’s 200-day moving average.
Check out the Monero coin guide for a quick look into the privacy coin.
For a deeper look we published a detailed DARE, part of our SIMETRI research offering.
Stay up-up-to-date with our live BlockTV feed!
They even took out the ads, to show their support for our cause!
The post appeared first on CryptoBriefing


