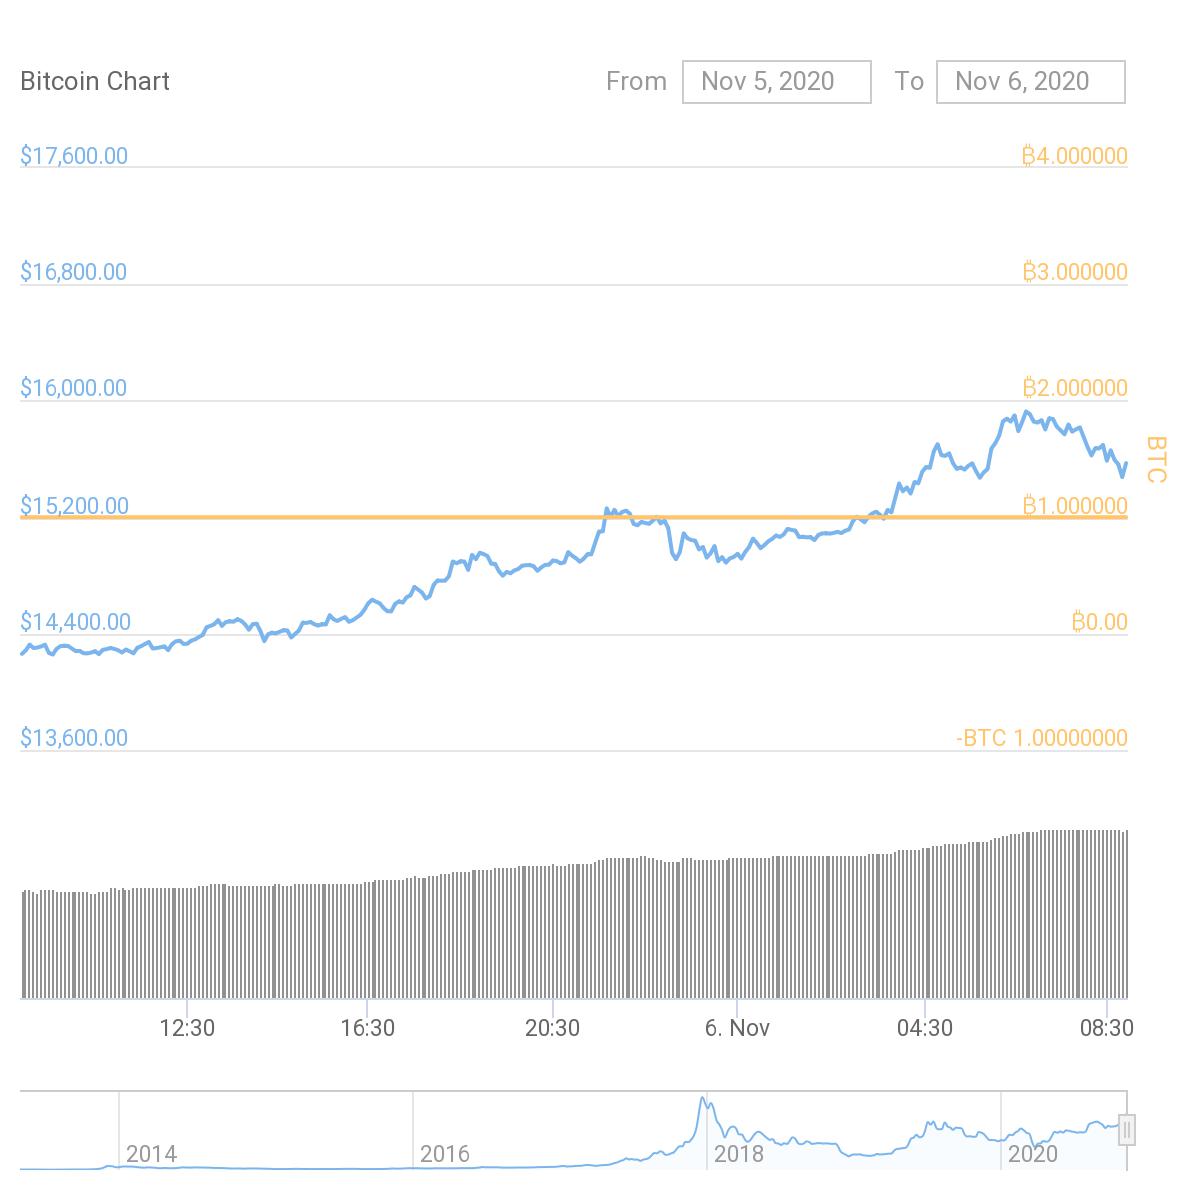
Five months into the third halving and Bitcoin’s price has rallied 75%. Most of this can be attributed to the race to over $15000 in the past 24 hours. There was a 6.47% daily gain and this could possibly be termed parabolic. Hitting a high of $15000 did not even surprise most seasoned traders as they anticipated a price rally post halving, and the one in July 2020 did not hit the mark. However, post halving rallies are short-lived and a correction occurs soon enough to establish equilibrium with new entrants to the market.
It’s interesting to see how narratives change and they are as volatile as the asset itself. When the price crossed $10500 and sustained for a little over three months, and when it hit a high of $13000 for 3 days continuously before closing above $13000, there was a maturity and sustainable price narrative. However, the current price rally is more of an overnight parabolic bull run, as observed in the 24-hour price chart.
In the 24-hour price chart, the spike above $15500, as it hit closer to $16000 is registered, however, it is rather short-lived. In the volume level, as per the chart, there was a striking resemblance in the pattern of the volume at the end of 2017 and the beginning of 2018. However, the average trade volume between 2019 and 2020 was higher than before 2018.
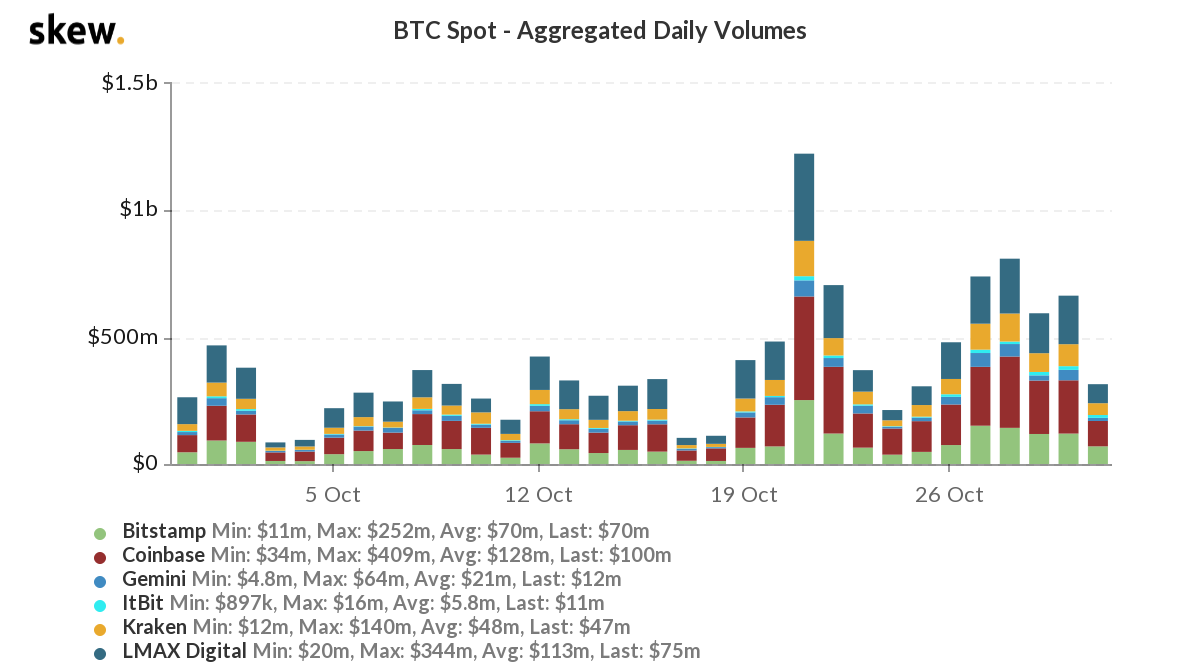
Other top factors that contribute to the volume and sustained price rally are trade volume on spot exchanges. The trade volume is of the same level as the last two weeks of August and exchange reserves have dropped sharply from $2.29 Billion to $2.20 Billion.
Based on data from skew, the trade volume is above the 60-day average, however, it has not hit the mid-August level yet. At the same time, dropping exchange reserves signal a price rise, but a drop in this level, with a buy wall, and nearly no BTC selling below $20k, the bull run is parabolic and a correction may possibly occur to strike an equilibrium.
The idea that there is “Virtually No BTC left for sale” is doing the rounds on Crypto Twitter, looking at this buy wall. However, such a situation cannot occur unless mining stops. Miners sell Bitcoin to cover operations costs and as mining difficulty increases, more computational power is required and costs rise. Unless 21 Million Bitcoin is mined and there are no further protocol upgrades, there will be Bitcoin on exchanges, and selling pressure will possibly be created by miners.
The current price rally may not be sustained due to driving factors like exchange reserves, trade volume on spot exchanges, and a volatile buy wall. Based on the current scarcity narrative, and a correction may occur soon enough for BTC to change hands and to strike an equilibrium.
The post appeared first on AMBCrypto


