Bitcoin, the world’s largest cryptocurrency, was trading at $10,147, at the time of writing, while Ethereum climbed as high as $361 before falling again. Stellar Lumens showed no change in its bearish outlook, however, and could drop even further. Ontology’s charts suggested that it might be in a consolidation phase after the drop from $0.95 to $0.60. Finally, VeChain continued to descend towards its own support levels.
Stellar Lumens [XLM]


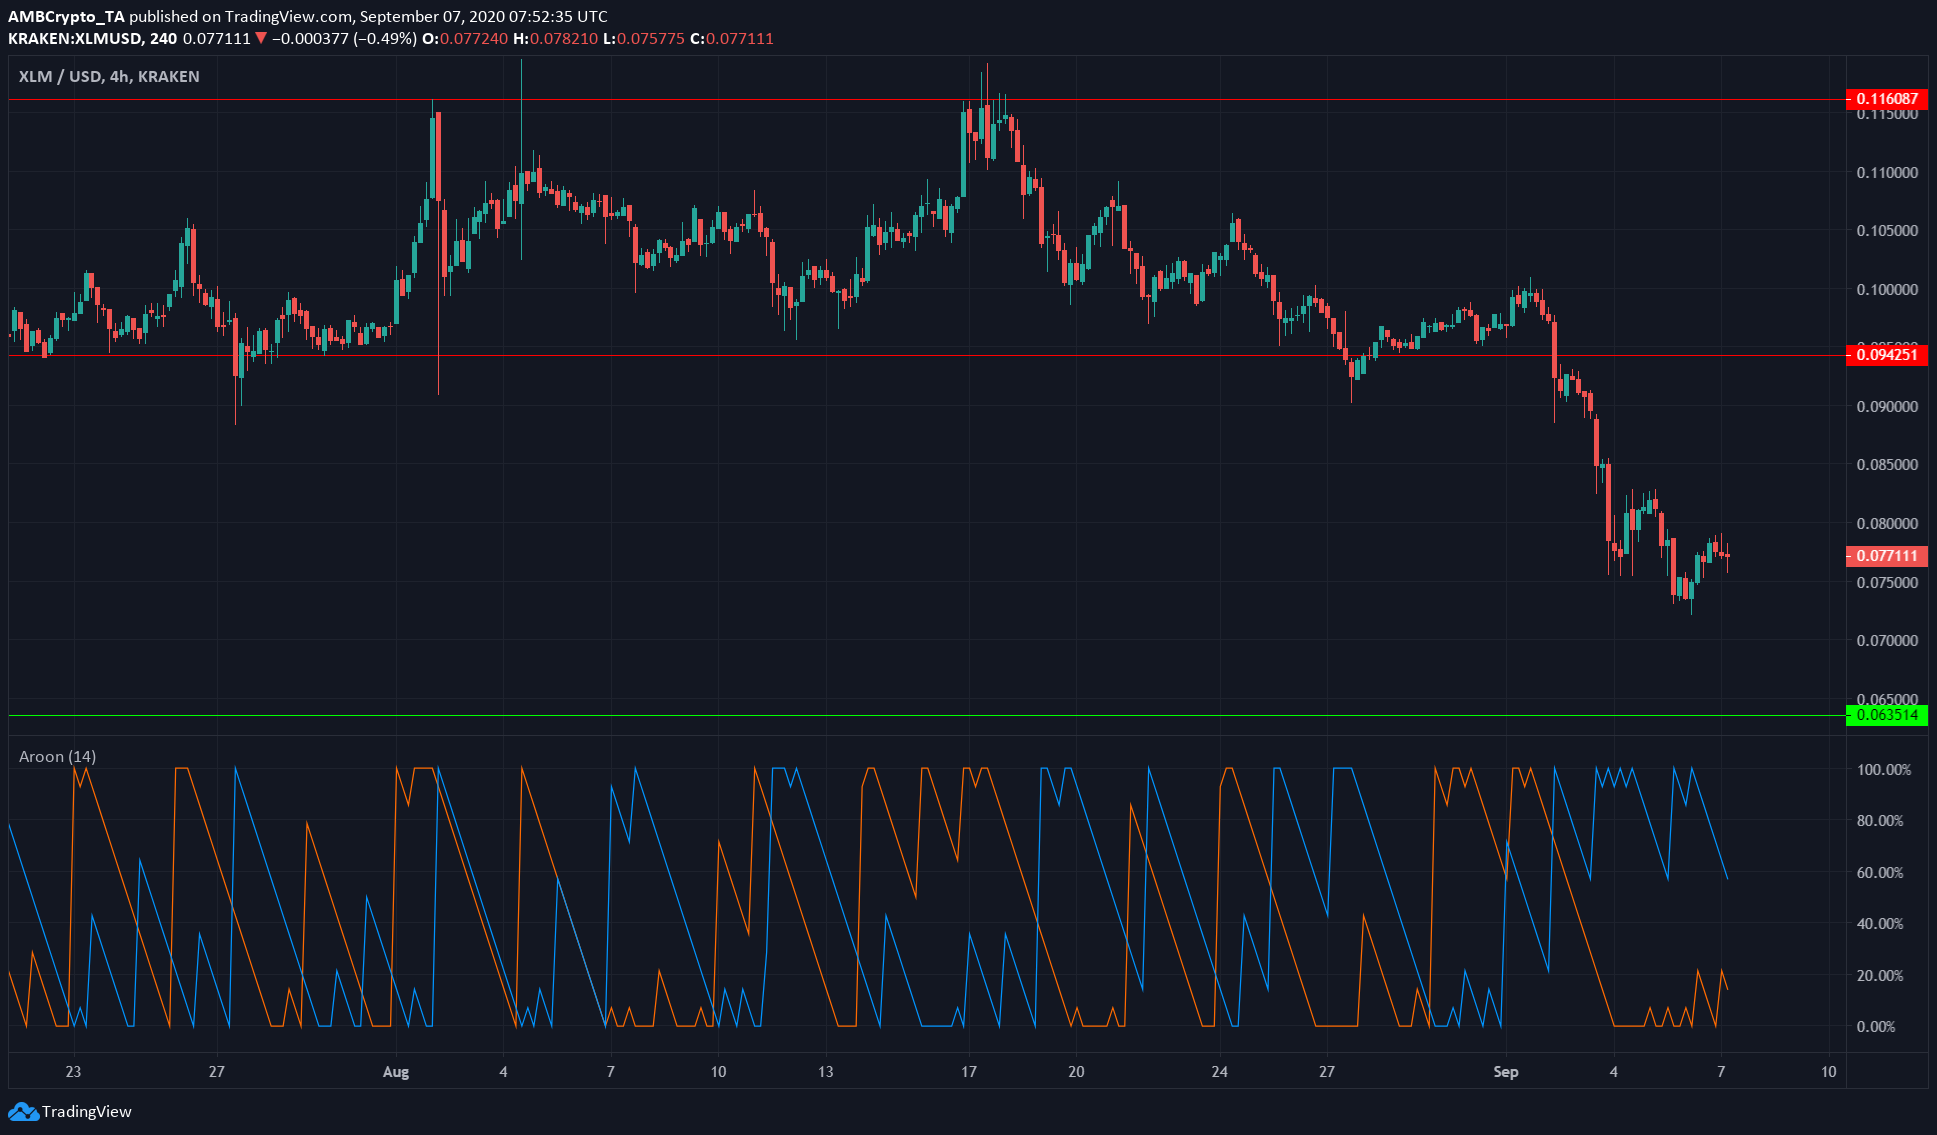
Source: XLM/USD on TradingView
The Aroon indicator showed that the downtrend for Stellar Lumens continued to remain strong. Further, the Aroon Down (blue) had not crossed beneath the Aroon Up (orange) in the past few days. Such a crossover could highlight a halt or reversal in the prevailing market trend.
Further, on the price charts, XLM’s price failed to register any higher highs, despite a recent bounce.
For the cryptocurrency, the next level of support lay at $0.063, at press time.
Ontology [ONT]


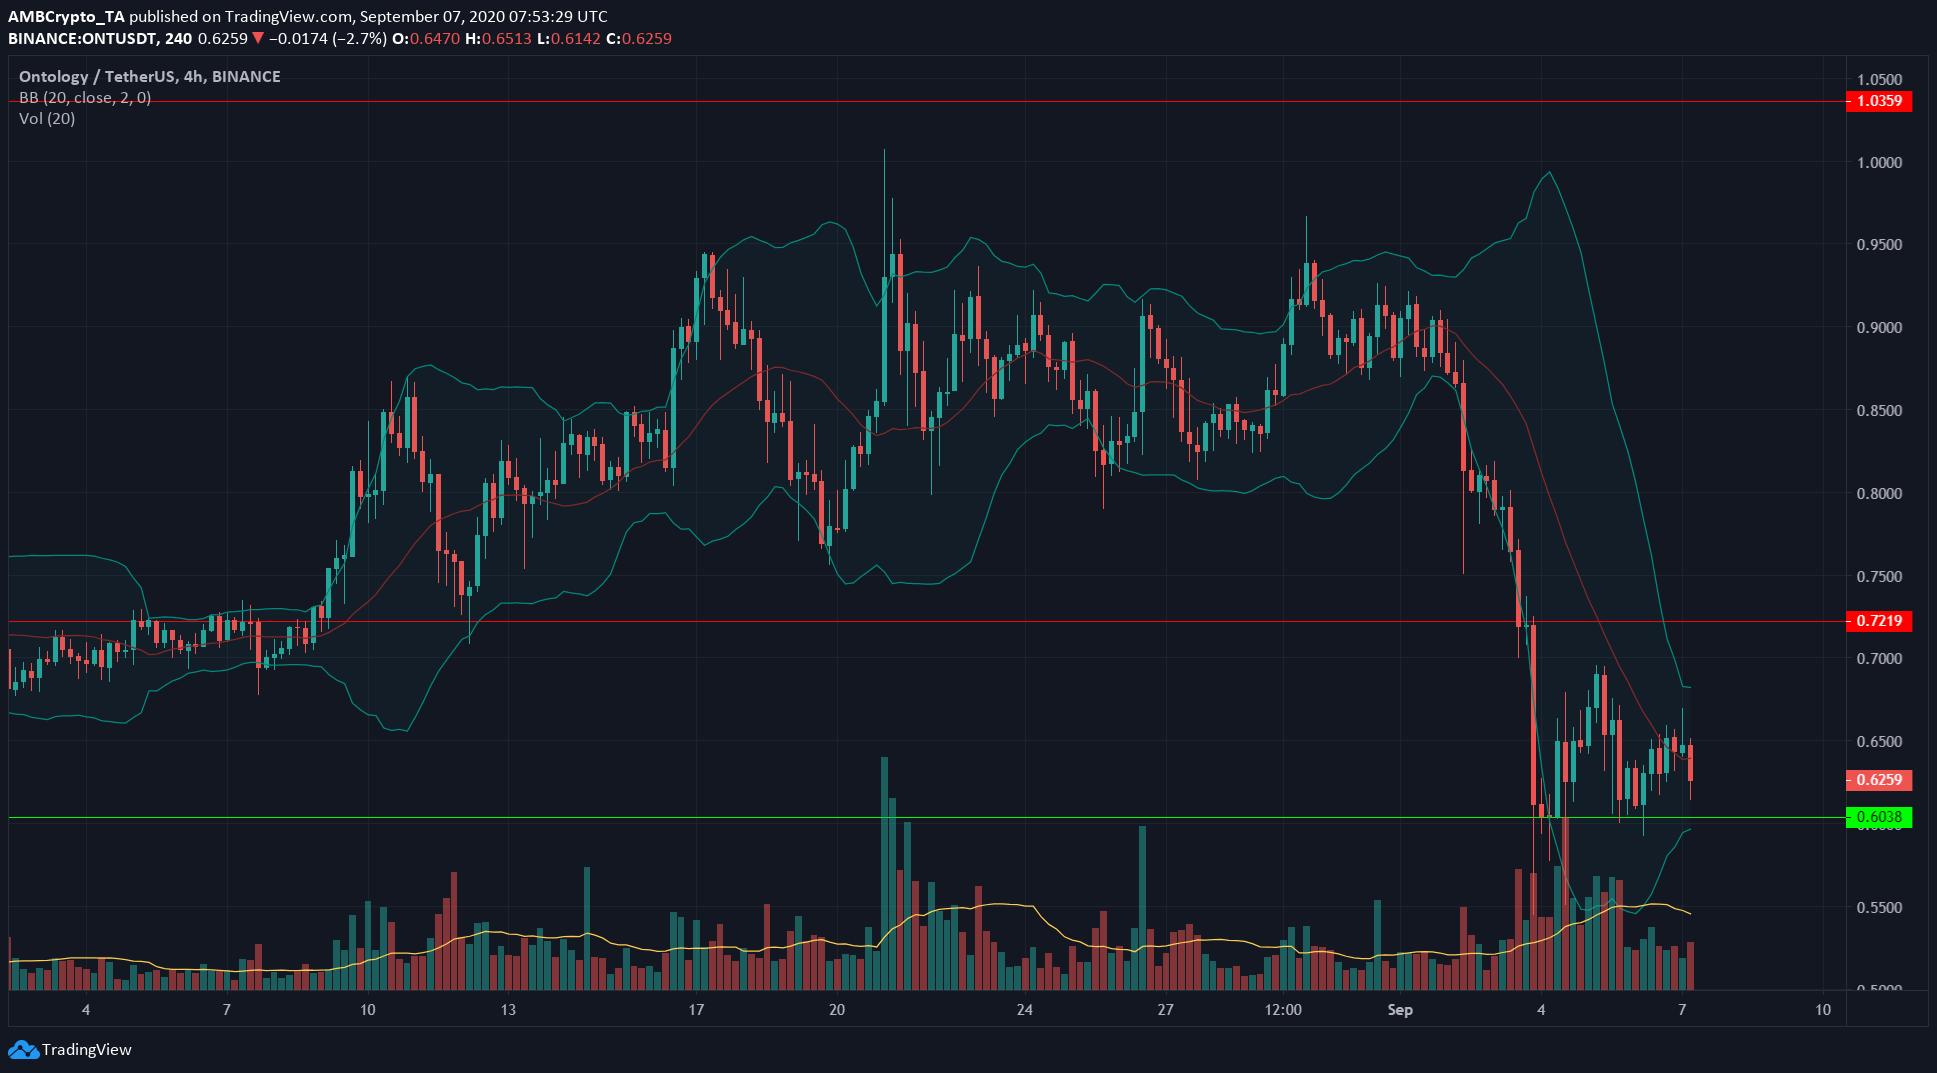
Source: ONT/USDT on TradingView
Ontology was trading above its support level at $0.6, with the next level of resistance observed to be at $0.72, at the time of writing.
The mouth of the Bollinger Bands was beginning to tighten, and if this were to remain the case, ONT’s consolidation above its support level could be in jeopardy.
ONT’s below average trading volume for the past few sessions has also reinforced the idea that consolidation might happen, with selling pressure cooling too.
The developers of Ontology recently announced that ONT and ONG, tokens of the Ontology blockchain, can be swapped for eONT and eONG on the Ethereum blockchain.
VeChain [VET]


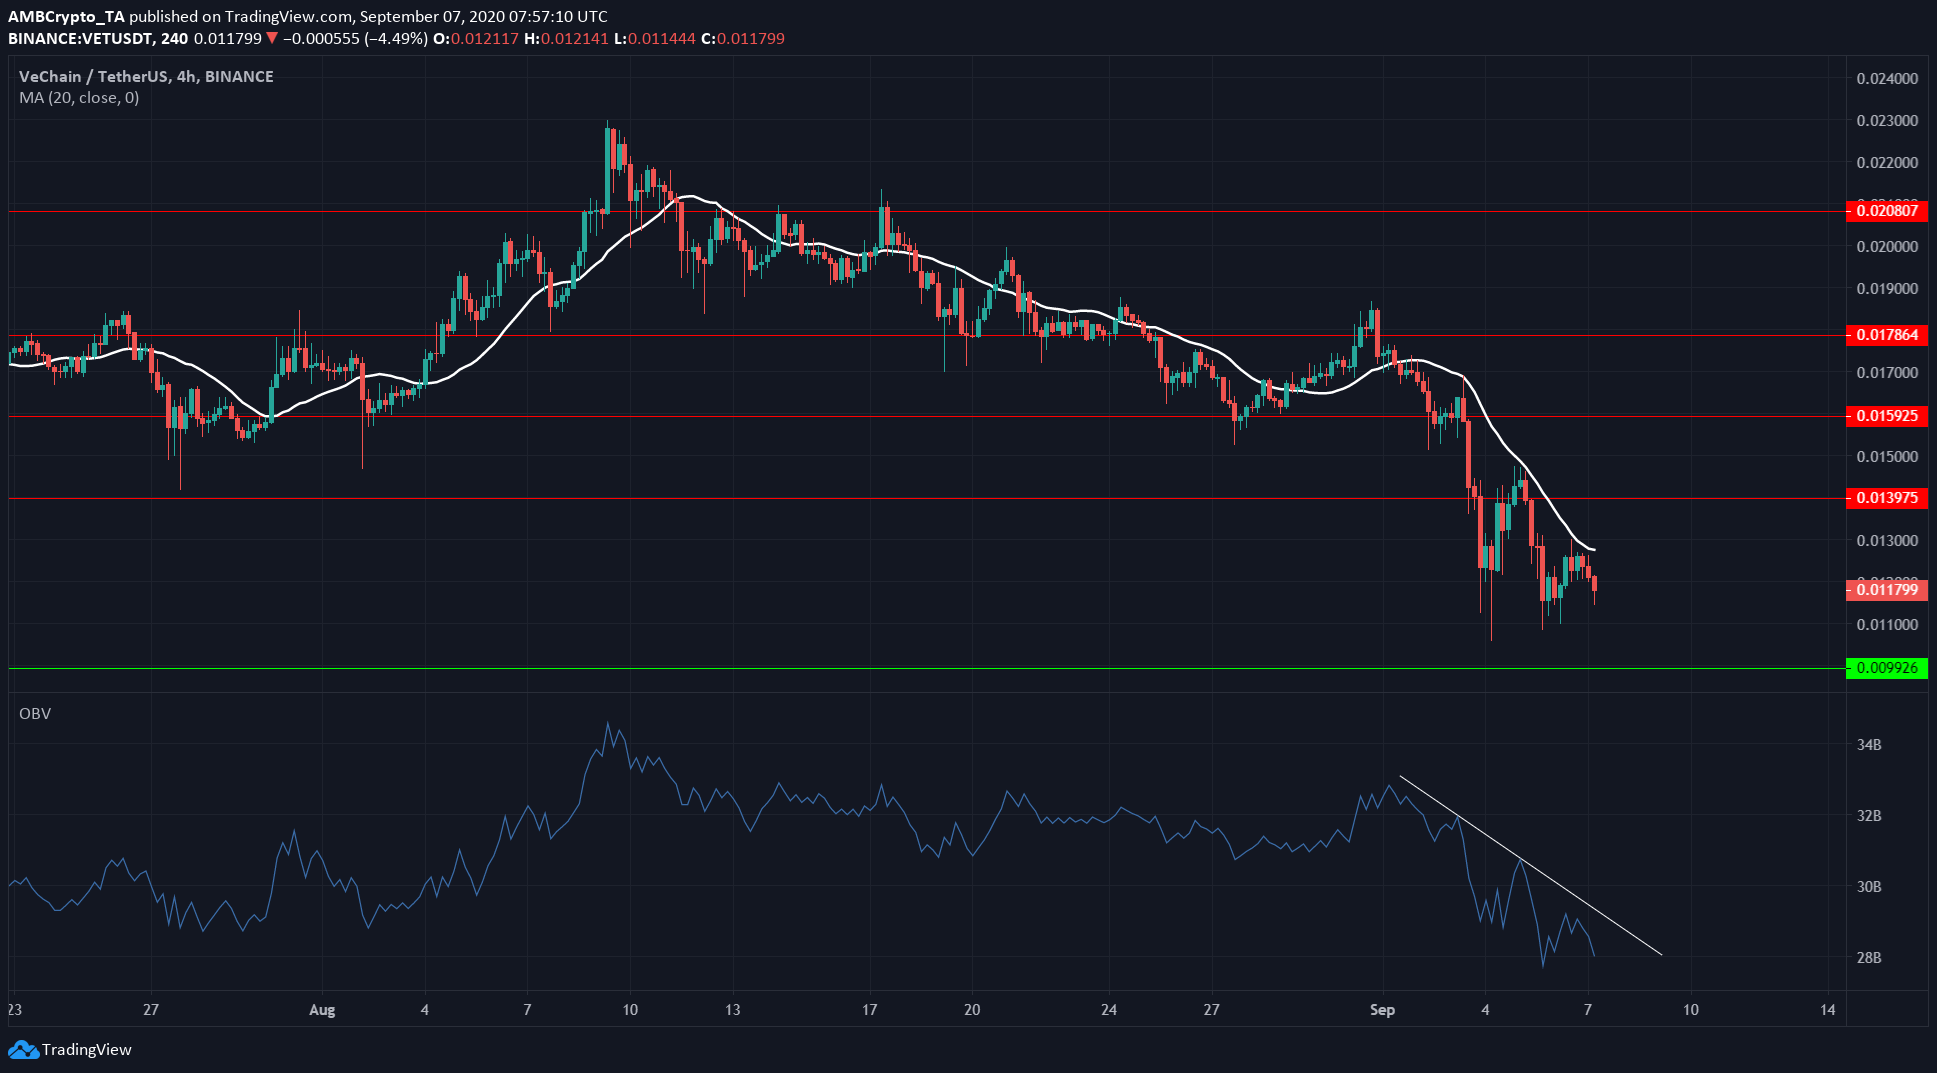
source: VET/USDT on TradingView
VeChain struggled to break past its 50 SMA (white) over the past few days. This moving average has acted as both support and resistance in the past and would continue to serve in the same capacity in the near-term.
The OBV showed that the selling volume in the market was rising. The white trendline highlighted that the OBV indicator would need to be swept before VET can target any upside resistance levels.
In other news, VeChain CEO Sunny Lu recently presented a six-phase model for the adoption of VeChain at the Shanghai British Chamber of Commerce last week, in a bid to inform its members about the benefits of blockchain in commercial applications.
The post appeared first on AMBCrypto


