While under the current developments a major bearish market for digital assets may correctly identify a suppressed trading scenario for bulls, various technical indicators still suggest that a strong reversal cannot be ruled out during the course of the fourth quarter.
However, altcoins like Polkadot, VeChain, and Basic Attention Token witnessed a strong descent to the downside following a sell-off flipping key support levels into resistances.
Polkadot [DOT]
The current sentiment surrounding Polkadot is comparable to the mid-September bearish scenarios with it recording a 20% drop at the time.
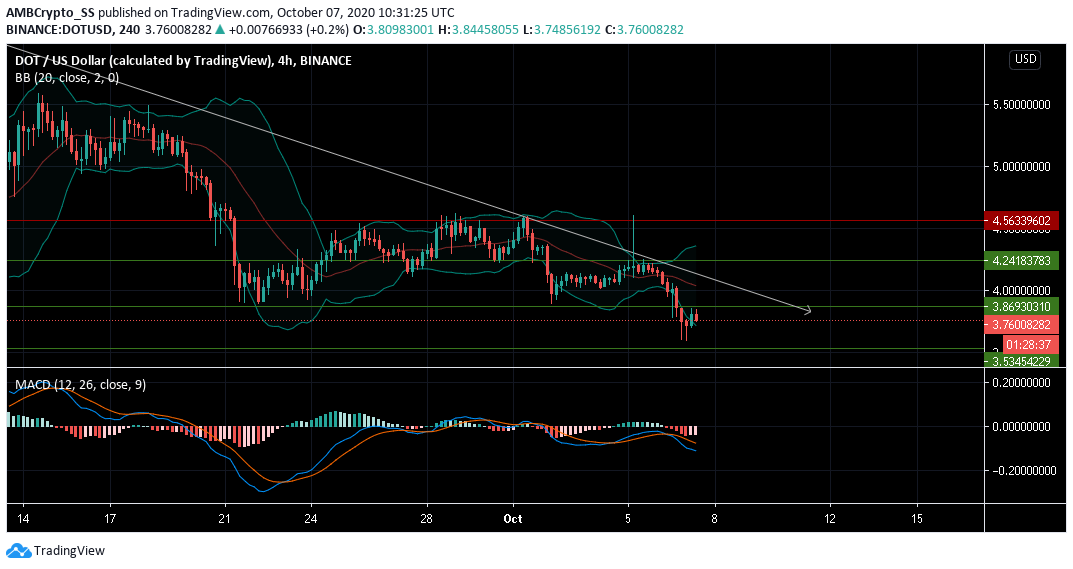
Polkadot at the time of writing recorded a price correction in the last 48 hours, as it continued its downtrend, witnessing a price slump to the $3.7 mark. In a bearish crossover, the MACD line dived below the signal line and was indicating a rise in selling pressure at press time.
The high volatility levels witnessed from the widening of the Bollinger bands, gave scope for further price action which could be favoring the bears. Given the bearish scenario, a price drop to the next support at $3.53 was also possible.
VeChain [VET]
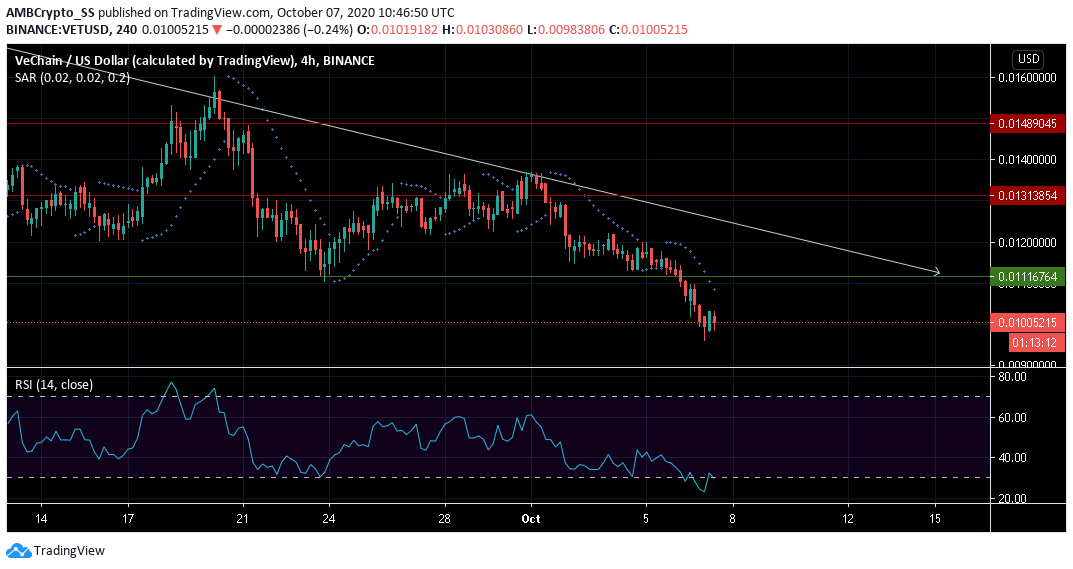
At the time of writing VeChain was trading at the $0.010 level, almost 15% lower than the crucial level of support turned resistance at $0.011.
The dotted lines of the Parabolic SAR above the candles hinted towards a downtrend, which was further supported by the rising selling pressure picked up from the Relative Strength Index.
At press time RSI was hovering just above the oversold region.
In other news, VeChain’s latest update enabled the use of a flourishing NFT ecosystem, and something that the VeChain foundation claimed was market valued over $300 Million by end of 2020.
Basic Attention Token [BAT]
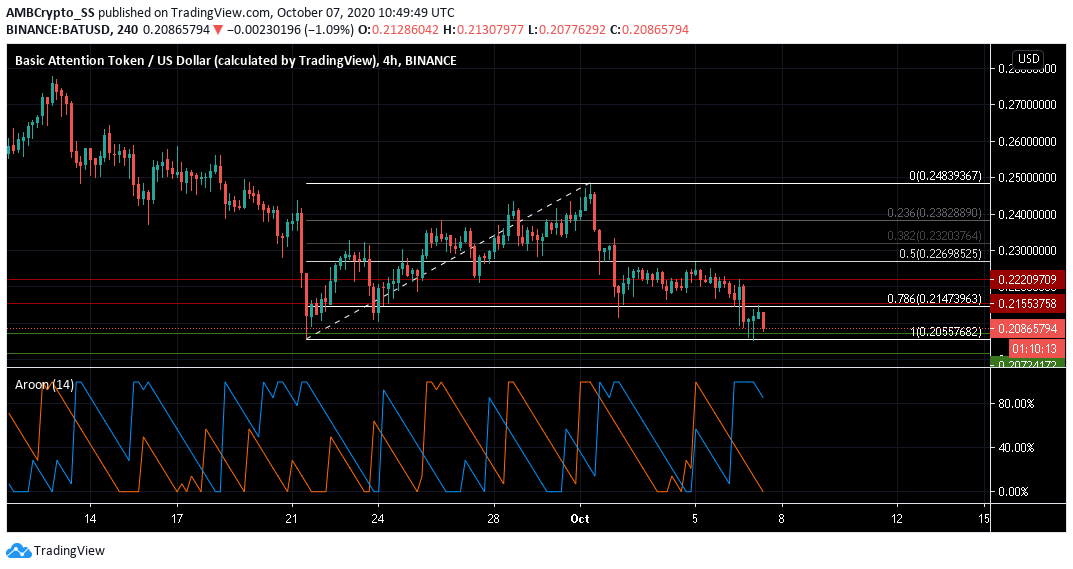
The Basic Attention Token at press time was trading just under the $0.208 level of support-turned-resistance after losing strength and dropping all the way down to the 100% retracement region as marked by the Fibonacci retracement tool.
The digital asset lost more than 10% in value over the last 48 hours and was under strong downward price momentum, as could be seen from the Aroon Indicator.
The bearish crossover, with the Aroon Down (Blue) rising above Aroon Up (orange) could further be indicative of the prices falling below the 100% retracement region.
The post appeared first on AMBCrypto


