We investigate the technical boundaries and limitations of the number of possible Bitcoin payments that can eventually be conducted via the Lightning Network. While it is only possible to study this question with more or less reasonable and debatable assumptions, we suggest considering natural congestion and depletion of channel liquidity due to selfish routing strategies as a significant source for payment failures and consequently decreased network reliability. While the concept of price of anarchy in selfish routing is well known, it seems not to map directly to the case of the Lightning Network. Typically when asking the question of congestion and price of anarchy one considers channels with a given bandwidth. If for example compared to a road, this would mean that – even with congestion – an arbitrary amount of cars could pass in one direction if there is no time constraint. However on the Lightning Network Alice’s channel may deplete after she forwarded all her sats to her channel partner Bob, disallowing her to fulfill additional routing requests to Bob which will result in payment failures on the network.
This article makes an attempt to define the price of anarchy and network congestion in the context of the “depleting channel model” for the Lightning Network. Channel depletion and drain seems to be emerging not only from supply and demand for sats by nodes on the network, but may be amplified as a result from the selfish routing strategies that nodes use to fulfill their supply and demand. Thus we suggest defining the Price of Anarchy as the change in the shape of the distribution of expected channel drain arising from selfish routing strategies, in comparison to the shape of that distribution if payments were centrally planned in an optimal way. With this definition we discuss the theoretical effects of various selfish routing strategies being applied and discuss future extensions to this research that would also consider secondary order effects like the very limited possibilities for selfish behavior of routing nodes (which could help with congestion and flow control) or the reaction to the selfish behavior of all participants. Finally we propose to study and find the Nash equilibrium for the behavior and dominant strategies of nodes on the Lightning Network.
Drain explains depletion and failure rate of channels
In a recent comment @bitromortac challenged the uniform assumption that we use in probabilistic payment flows. While the strength and usefulness of optimally reliable and cheap payment flows in combination with probabilistic payment delivery has recently been independently verified by Dr. Carsten Otto the observations by bitromortac go along with our initial research. Back in 2020 we did not observe a sole uniform distribution of liquidity on the network – which we use as a prior belief to compute optimally reliable and cheap payment flows – but instead about 30% of channels were depleted. Back then we thought this was due to newly or poorly maintained channels. Now using some techniques and ideas of random walks we can explain with a given drain how likely it is that a channel is goint to be depleted. This is equivalent to an expected failure rate for payments on the network. In this context, drain is defined as the likelihood that a payment on the channel goes along a certain direction.
This likelihood can be derived for example by collecting and evaluating routing statistics from operating a node or – as shown below – can be estimated from the selfish routing strategies of nodes by just looking at publicly available data. For example a weak drain of 0.5 means that the same amount of payments has been (or is expected to be) observed in both directions. On the other hand a strong drain of 1 means all payments go in one direction. The latter is equivalent to a value of 0 if we consider the opposite direction.
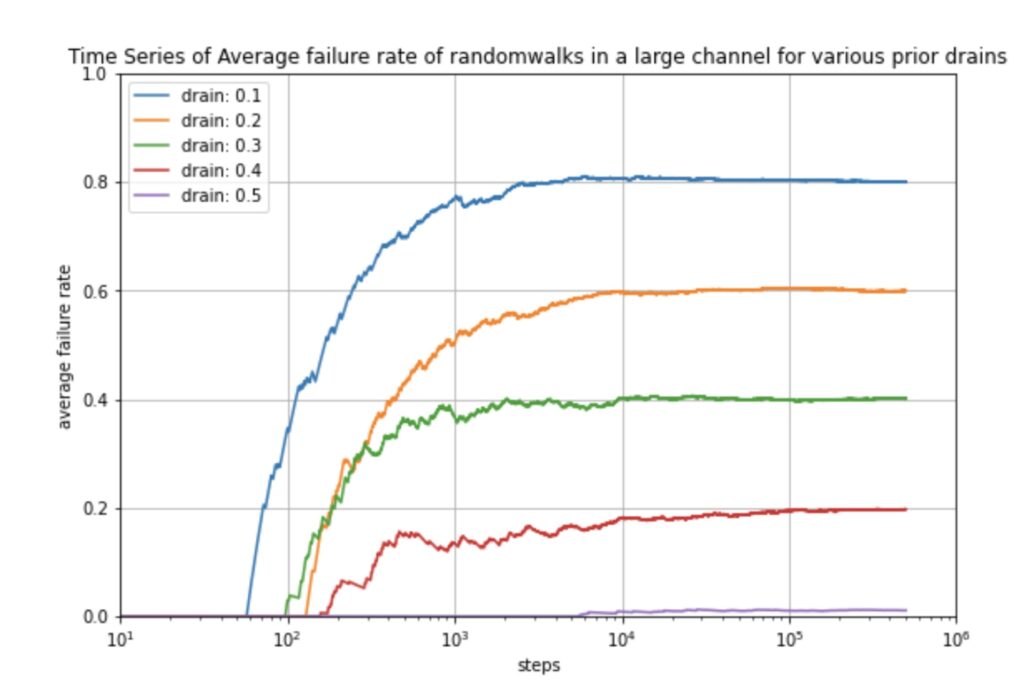
Long story short: When conducting the random walk on a payment channel with a fixed assumed drain the (expected) average failure rate for a random payment on that channel becomes stationary if enough payments are being conducted:

Even for a strong drain like 0.1 (which is equivalent to a drain of 0.9 in the other direction) we can see that we can still expect 20% of all payments to succeed. This is due to the fact that the lower likelihood payments in the direction opposite to the drain will be successful and undeplete / refill the channel. This in turn allows again a few payments to be successful in the direction of the assumed or estimated drain.
We note that one should actually more precisely look at the situation. So far we assumed a random payment but of course we can study random payments in the direction of the estimated drain or against the direction of the drain. For example for a strong drain of 0.1 or 0.9 a random payment has a 20% chance to be successful. However intuitively we can estimate that almost all of the payments going against the direction of the drain will be successful. Under this rough estimate we can analytically compute the success rate in the direction of the drain: So initially we have 0.1 * 1 + 0.9 * x = 0.2. Where 0.1 = the 10% payments going against the drain. The 1 represents the 100% success rate of those payments. 0.9 represents the 90% of the random payments that go with the drain and x presents the success rate for those payments. Finally 0.2 represents the observed 20% from the stationary part of the diagram. Solving for x we can see that we only expect 11.1…% of all payments in the direction of the drain to be successful.
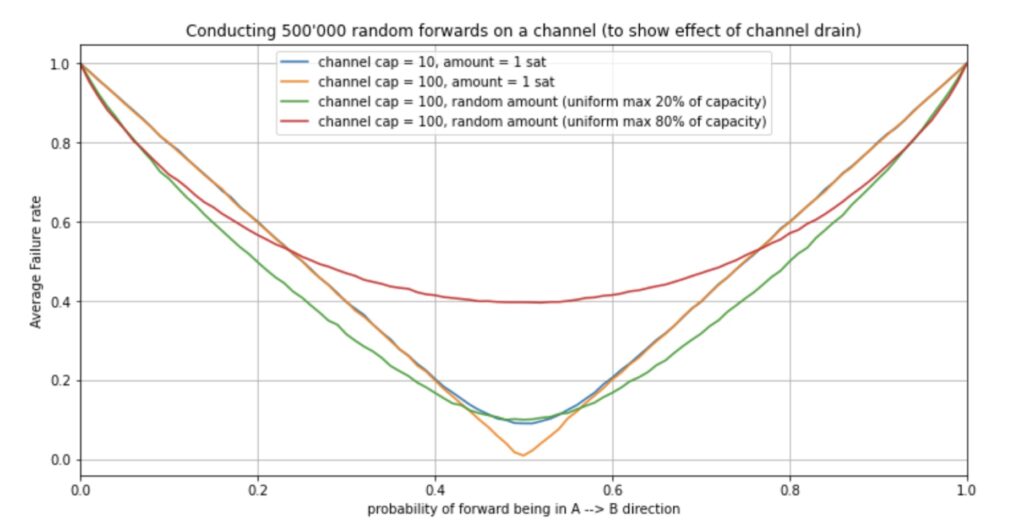
Another way to look at such data is the following diagram where we computed the stationary (expected) average failure rate for a random payment given an assumed drain on the channel.

In general we observe that weak drain (values around 0.5) results in lower failure rates. And strong drain (values closer to 0 or 1) result in higher failure rates. Notice that the 3rd and 4th curve considered random walks and the resulting stationary failure rate where the amounts were randomly selected (following a uniform distribution) between 1 sat and a certain percentage of the channel size. We observe that for channels with strong drain larger payment amounts actually reduce the failure rate. However channels with a weak drain increase their failure rate if we send larger payments.
We see – similar to the uniform model for expected success rate – that while we expect the channel to be depleted we may not wish to send too large payments (at least not in the direction of the drain)
Selfish routing strategies predict stronger drain on channels, payment failure and lower network reliability
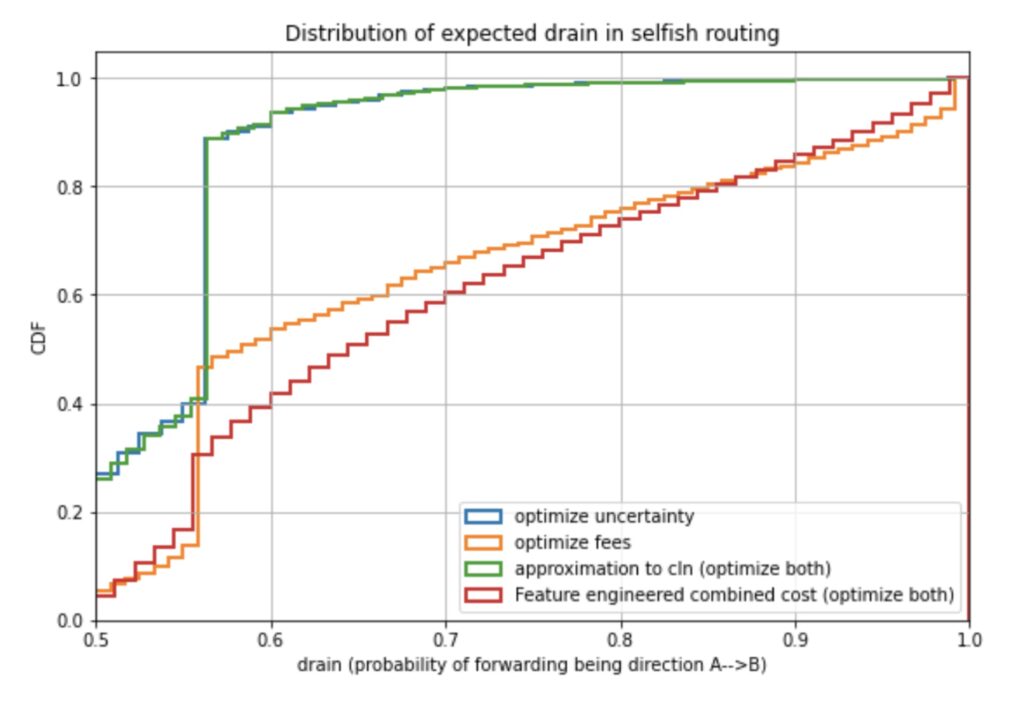
Defining a cost function and optimization goal for path finding or min cost flow computation is considered to be a selfish strategy. Thus computing the cheapest paths with respect to a given cost function between all node pairs (which is a very strong assumption) we can estimate purely from gossip how much drain we expect to see on every channel. In combination with the above result we can estimate the failure rates that we can expect to occur on every channel. This observation does not need a single probing but of course the results may be verified by crawling the liquidity information from the network. Under the given assumptions of equal distribution of all payment pairs we expect that a global coordinator can organize the traffic where all channels have a weak drain value of 0.5 and we can compare this to the distribution of drain values given other strategies.

Note the faster the curve grows against 1 the less drain (and failure rates) we expect to see on the network. We can observe that optimizing for reliability (given the uniform model by minimizing the uncertainty cost) we can expect little drain on the channels and thus an overall lowerer price of anarchy. Optimizing for fees – given the current fee structure of the network – shows us that we expect far more channels to have stronger drain. Thus the price of anarchy increases. Remarkably the highest price of anarchy comes if nodes use the strategy that we currently considered as the most selfish strategy which emerged from feature engineering in the optimally reliable and cheap payment flow research. In that case the selfish strategy optimizes for both low fees and high reliability (via low uncertainty cost). While individually this strategy seems very good for a sending node we can expect overall adoption of this strategy to result in depleting more channels. This subsequently produces higher failure rates and lower reliability on the network and – as already said – the highest price of anarchy (within these four strategies).
Of course these theoretical observations do not consider that in practise we might have second order effects e.g:
- Routing nodes also behave selfishly (which is very limited through protocol design) by changing the topology of the network through
- Adopting fees (limited through gossip relay policies to prevent spam)
- Opening / closing channels (limited through block space)
- Pro active off chain rebalancing (limited through fees that other nodes charge and finding opportunities to conduct rebalancing)
- Pro active on chain rebalancing (limited through block space and routing fees)
- Sending nodes may take the selfish behavior of others into account and try to game them by adopting their own selfish strategy. As indicated above a node may try to only consider routing along channels against the expected drain.
- Various nodes may not have a single cost function. This is already the case, as we have various implementations. We could already randomly select the routing strategy following the implemented strategies to see how much drain / depletion we observe.
- Also of course we need to adapt our definition for price of anarchy to the case where payment pairs are not equally likely and where we might observe drain and depletion of channels even with a perfect central coordinator who globally plans the best strategy to deliver sats.
It seems obvious that none of our considered strategies is a dominant strategy with respect to the Nash equilibrium and we strongly suggest finding the dominant selfish strategy and studying its price of anarchy.
Currently our best hope is that the selfish behavior of both routing and sending nodes and secondary effects in which nodes adapt their selfish strategies to dominant strategies produce a Nash equilibrium with aligned interests, stability at high reliability. As a potential outlook take for example @zerofeerouting who uses liquidity ads to charge fees to nodes that need inbound liquidity but does not take a routing fee to forward payments. IF this strategy was dominant and moved the fee market away from charging routing fees then the sending nodes would be able to focus their selfish strategies on reliability which would – given our current assumptions – produce the lowest price of anarchy, a lower number of depleted channels and lower failure rates. While I currently do not understand if this strategy and the reply of the sending nodes will in fact become dominant, the operator behind zerofeerouting seems to be convinced enough to incentivise the creation of a high bounty for the developer who adds liquidity ads to lnd.
Finally for the summer of Bitcoin I supervise two students (Sebastian and Krystal who kindly and critically reviewed initial drafts of this text). They will help us to understand how we can model and compute the Price of Anarchy on the Lightning Network properly and maybe even derive dominant strategies and a Nash equilibrium. Due to initial conversations and explaining to my students the details of how I was thinking about these problems so far I came up with the described preliminary way to define the Price of Anarchy for routing sats over the Lightning Network under selfish strategies which I described in this article. You can find the ongoing work and results in the lnresearch repository.
Related
The post appeared first on Blog BitMex


