TL;DR
- Ripple (XRP) saw a tidy 4.5% price increase over the past 24 hours to reach above $0.25.
- Against Bitcoin, XRP surged 5% but met resistance at a descending trend line.
- If XRP can break above the 200-days EMA, the 2020 bull-run is likely to continue toward $0.30.
Key Support & Resistance Levels
Support: $0.245, $0.234, $0.227.
Resistance: $0.26, $0.274, $0.289.
Support: 2600 SAT, 2525 SAT, 2455 SAT.
Resistance: 2800 SAT, 2900 SAT, 3000 SAT.
XRP/USD: XRP Rising Above $0.245 To Reach $0.26 Resistance
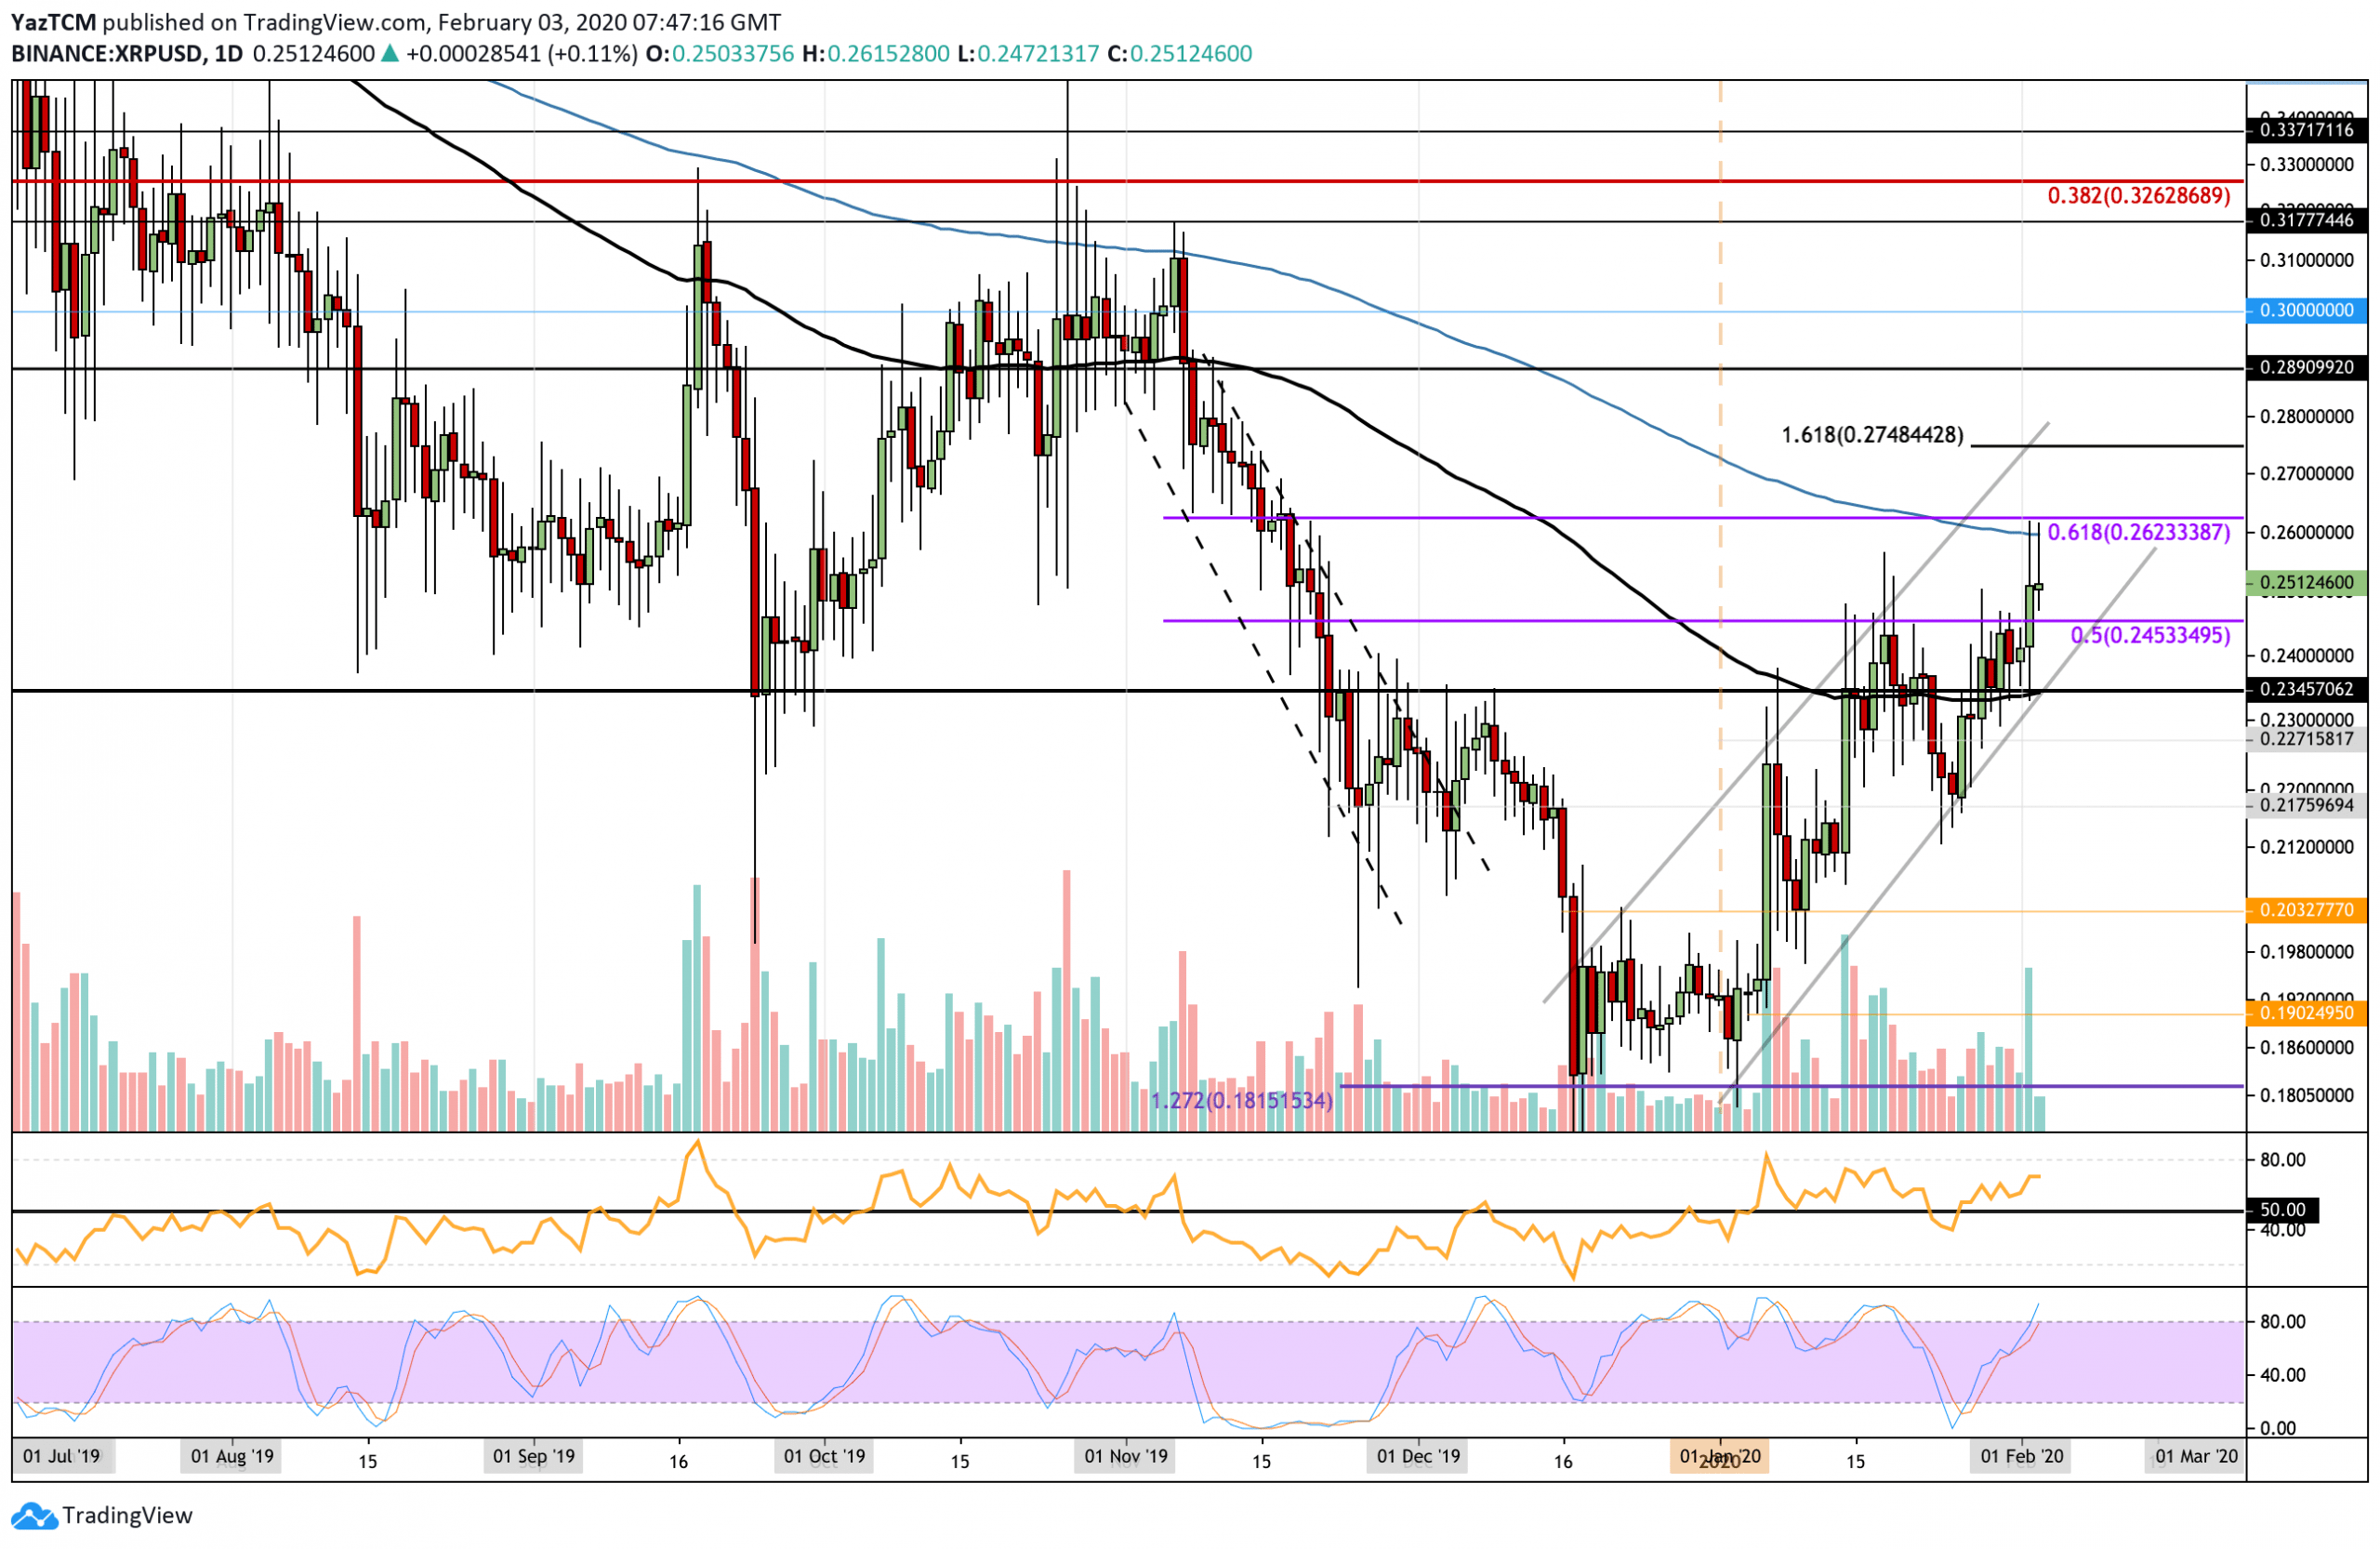
Since our last analysis, XRP was successful in climbing above the previous resistance at $0.245 after struggling at this level throughout January. It then climbed higher to reach the resistance level at $0.26, provided by the 200-days EMA, and then rolled over slightly from here as it trades slightly above $0.25, as of writing these words.
It is essential to highlight the current ascending price channel that XRP has been trading within for the past 6-weeks as this shows a clear establishment of a short-term bullish trend.
The break above $0.245 also had granted a 2-month price high for XRP. For the trend to continue, it better break above the 200-days EMA or Exponential Moving Average. On the other side, if it were to drop beneath $0.23, the market could turn neutral, as long as the coin keeps up the $0.21 level.

XRP Short Term Price Prediction
If the bulls can push the price above the 200-days EMA at $0.26, the first level of resistance lies at $0.274 (1.618 Fibonacci Extension). Above this, resistance lies at $0.289, $0.30, and $0.317. Alternatively, if the sellers push XRP lower, the first level of support lies at $0.245 (January resistance). Beneath this, support lies at $0.234 (100-days EMA), $0.227, and $0.217.
The RSI remains above the 50 levels to indicate the bulls are still in control over the market momentum. However, the Stochastic RSI is approaching overbought conditions, and a bearish crossover signal might cause the market to retrace for a possible correction.
XRP/BTC: Inside a Descending Channel
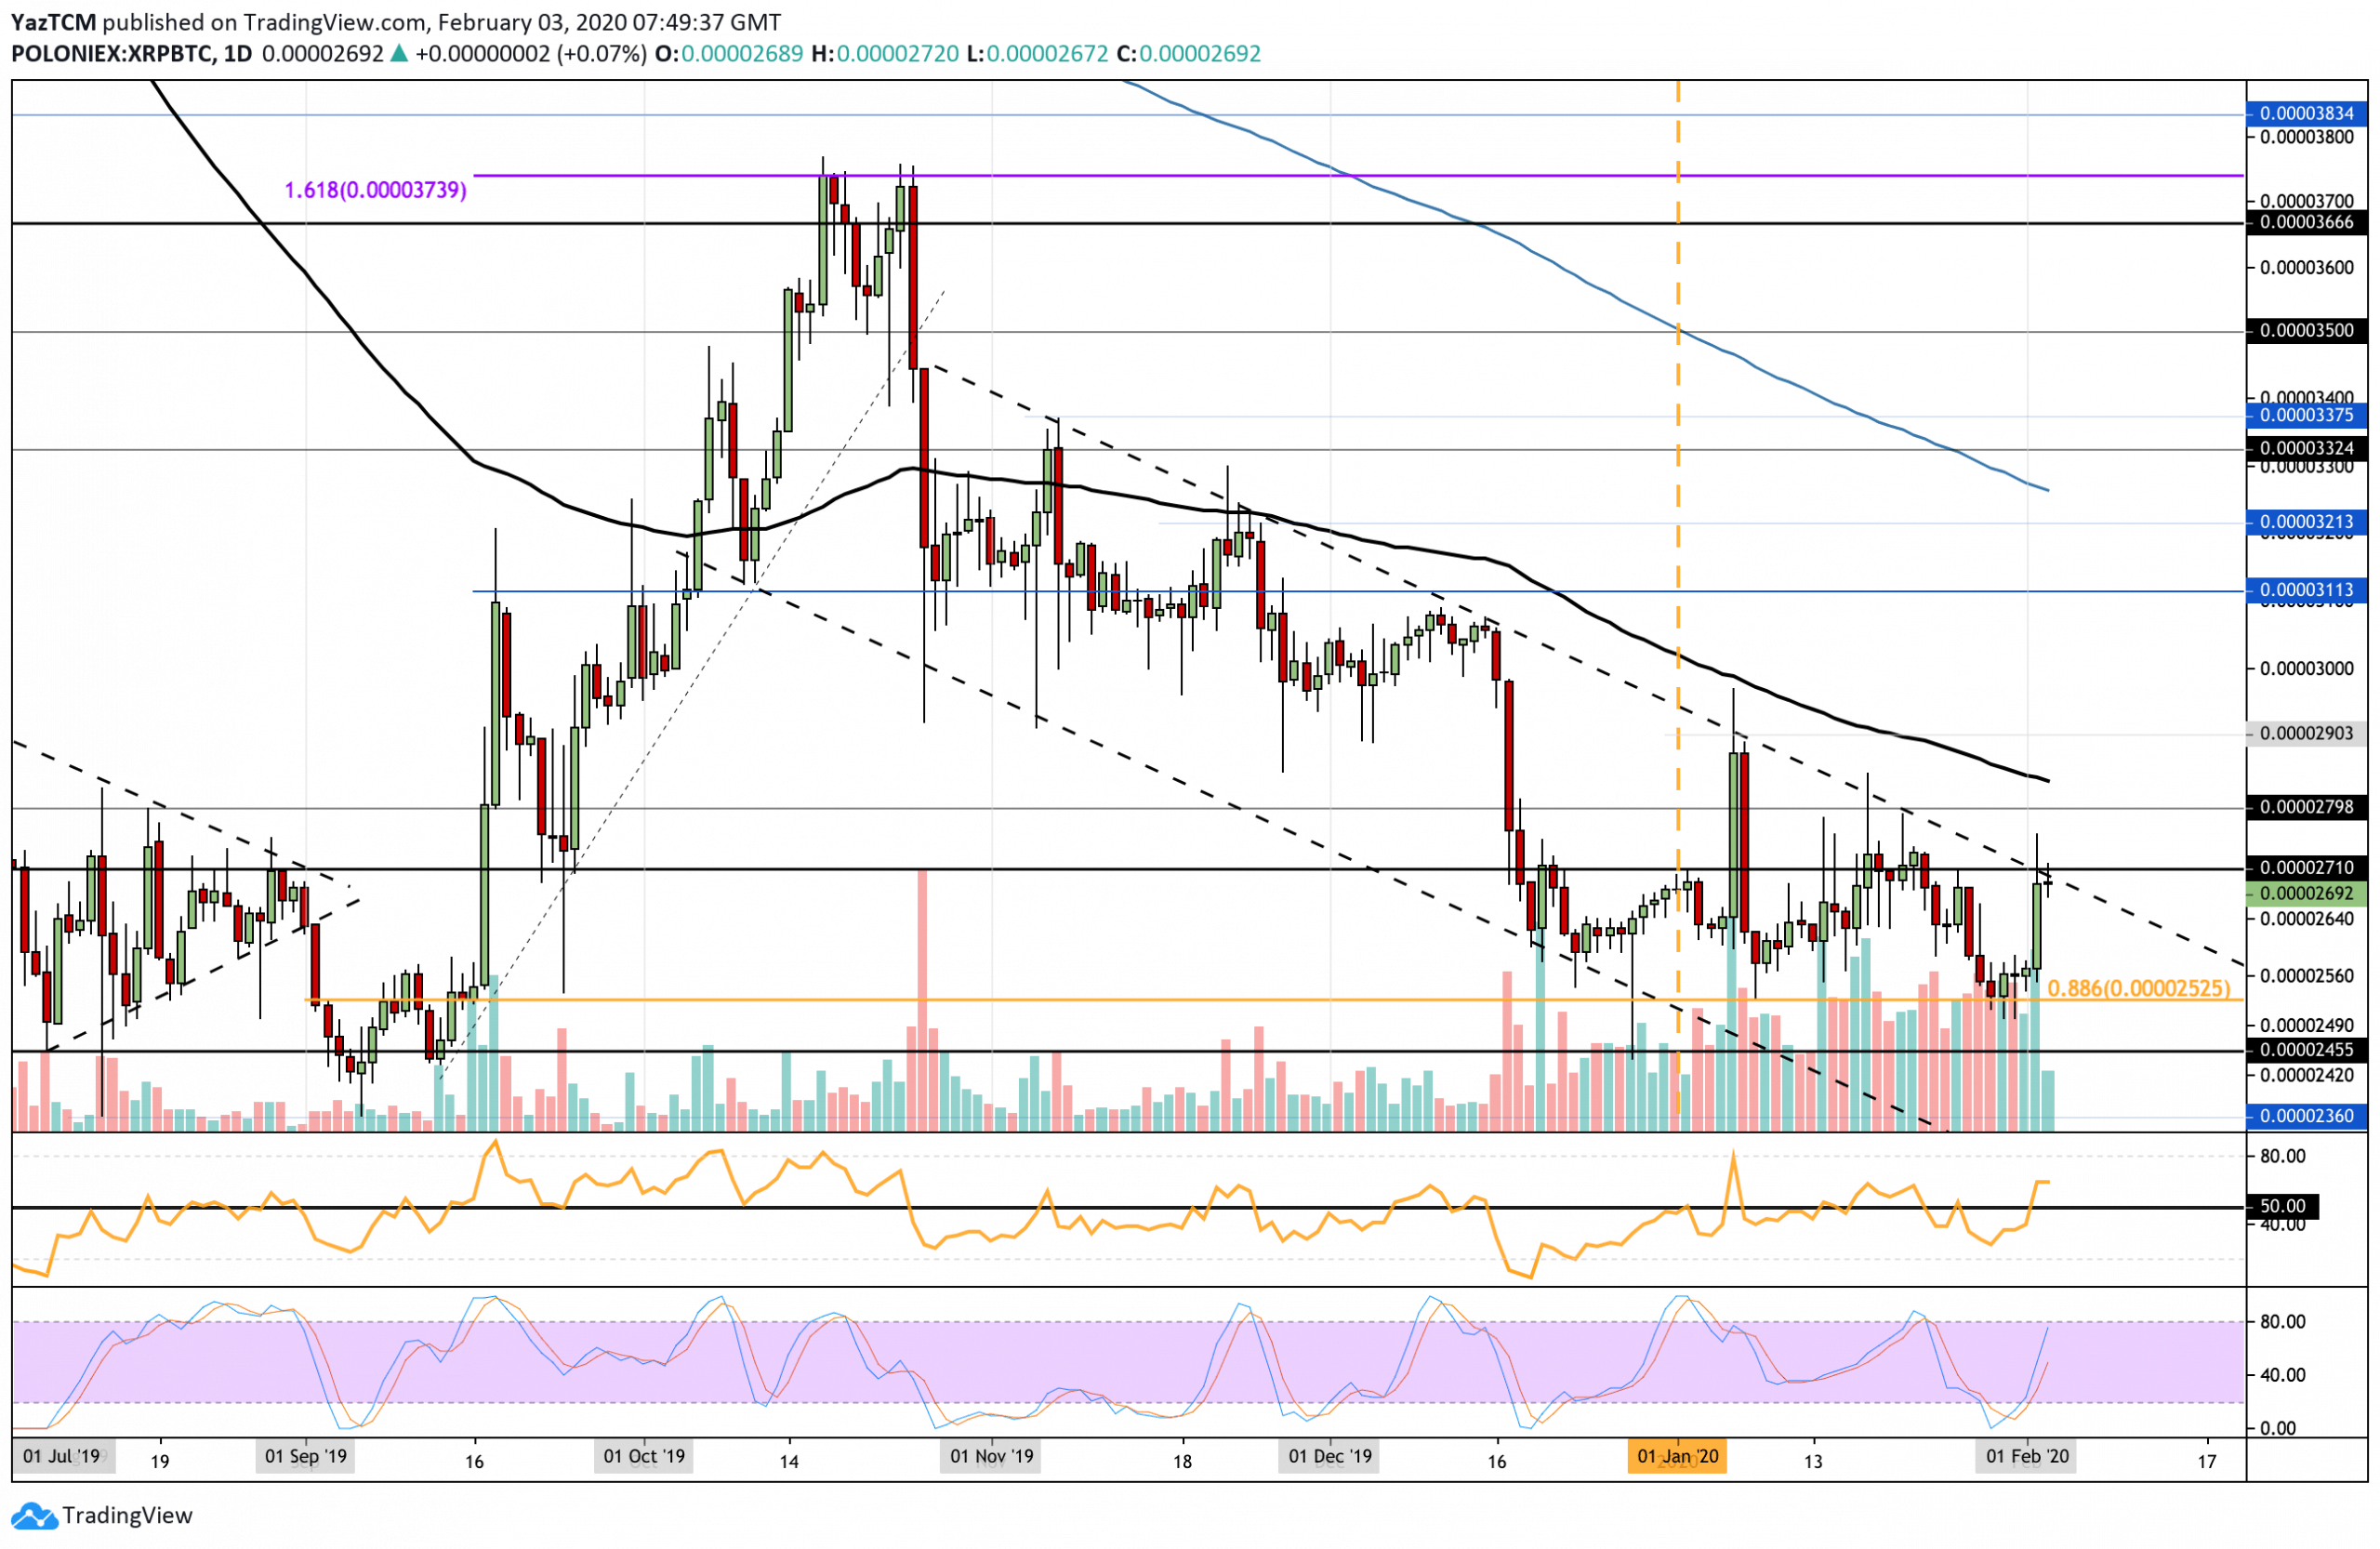
Against Bitcoin, XRP continued to rebound from the 2525 SAT support to reach the 2710 SAT level. However, it met resistance at a 3-month old descending trend line and is currently struggling with the level.
The neutral trading condition continues for XRP/BTC. To turn bullish, it must break above the 3000 SAT benchmark to overcome January’s high. The coin better keeps up with the 2525 SAT level.

XRP Short Term Price Prediction
If the buyers manage to break above the mentioned descending channel, higher resistance is expected at 2800 SAT. Above this; resistance lies at 2900 SAT and 3000 SAT (January highs).
On the other hand, if the falling trend line causes XRP to reverse, then the first level of support lies at 2600 SAT. Further support levels lie at 2525 SAT, 2455 SAT, and 2400 SAT.
The RSI is above 50 but has flatlined after meeting the falling trend line resistance. The RSI better remains above 50 and head higher for us to break this falling trend line. The Stochastic RSI recently produced a bullish crossover signal that helped the rebound from 2525 SAT.
Disclaimer: Information found on CryptoPotato is those of writers quoted. It does not represent the opinions of CryptoPotato on whether to buy, sell, or hold any investments. You are advised to conduct your own research before making any investment decisions. Use provided information at your own risk. See Disclaimer for more information.
The post appeared first on CryptoPotato


