- Across trading pairs, XRP is charting a loss of 1.24% at the moment.
- Against Us Dollar, XRP looks for a strong rebound level while captured in a falling wedge.
- Bearish bias may elapse beyond expectation if XRP fails to find support on channel pattern.
XRP/USD: XRP Sharply Bounced Near $0.21 Support, Has the Correction Ended?
Key Support Levels: $0.21, $0.20
Key Resistance Levels: $0.23, $0.25

XRP/USD Chart. Source: TradingView
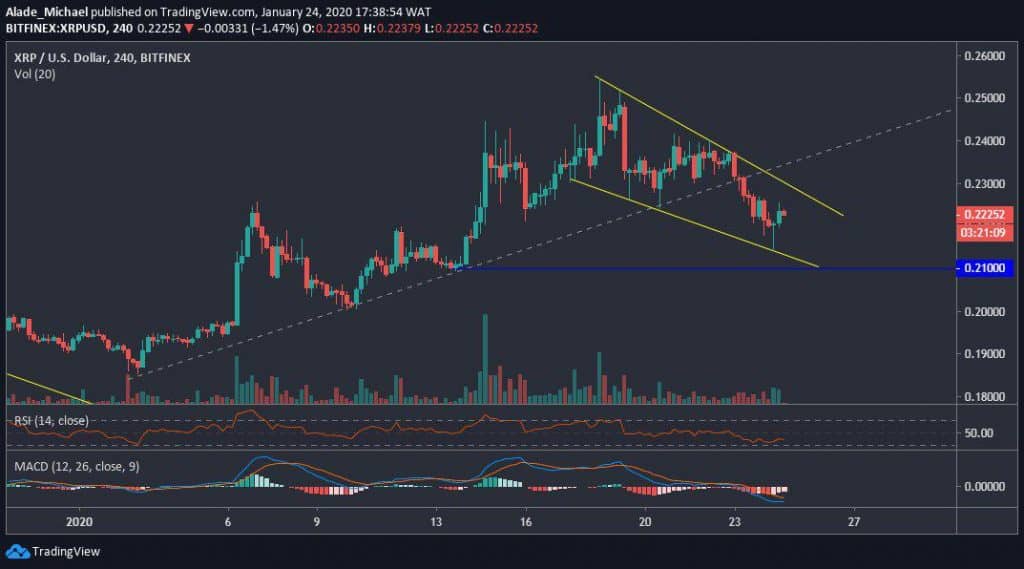
Since our previous price analysis, Ripple’s XRP saw a lot of selling pressure, breaching the mid-term rising trend line into a new falling wedge pattern. After touching the wedge’s support – around $0.21 today, XRP bounced off near the wedge’s resistance. We can expect a rejection once XRP reaches this resistance.
At the time of writing, the 3rd best-performing cryptocurrency by market cap is trading around $0.222 against the US Dollar and, at the same time, charting a loss of 1.24%. XRP is expected to bounce back as soon as it finds a solid support level.
Ripple Short-Term Price Analysis
The short-term bearish correction is still looking pretty valid for XRP, but it may soon end if we consider the descending wedge pattern forming on the current 4-hours chart. Just a few hours ago, XRP saw a quick bounce after falling on the wedge, very close to the blue horizontal support line of $0.21. This support could possibly provide a rebound for the next bullish rally.
If XRP fails to regain momentum at this mentioned support, the next level to keep in mind is $0.20 – the January 6 break level. Here, we can expect buyers to start stepping back into the market. But looking at the RSI indicator, XRP has dropped to the oversold level to show that sellers are still present.
Conversely, the MACD has entered the negative zone to suggest that the market is under the bearish radar. However, if XRP manages to recover and breaks up the falling wedge, the next buying target would be $0.23 and $0.25 resistance level before breaking higher.
XRP/BTC: XRP Continues To Fall in a Channel As No Sign Of Bullish Yet

XRP/BTC Chart. Source: TradingView
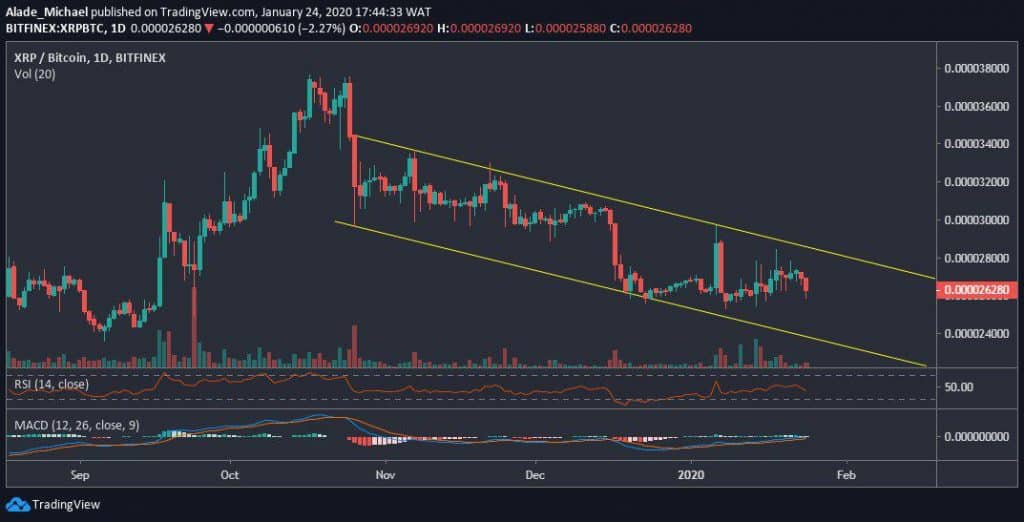
Against Bitcoin, XRP continued to look for support since the market reversed in late October 2019. At the time of writing this analysis, XRP is hovering around 2628SAT price levels. The bearish correction is shaping the inside channel for the past three months now.
If XRP fails to break up this descending channel, the price could roll back to September 2019 support of 2400SAT levels before deciding on where next to head. However, a notable price push above the channel should provide us with a strong buy setup.
Ripple Short-Term Price Analysis
The daily chart for Ripple’s XRP shows that bearish bias is still dominant in the short-term perspective. As we can see, the price is still falling in a three-month channel with no sign of break at the moment. Meanwhile, the XRP/BTC volatility has been quite low since the trend reversed from the 3760SAT level.
From a technical standpoint, the price of XRP is likely to witness a long bearish momentum if this wedge continues to form. We can see that the RSI indicator is currently dropping. XRP may soon drop into the channel’s support of the 2400SAT level. A steep break beneath the channel may tank XRP to the new support.
Though, the MACD is currently on the verge of producing a bullish crossover. If XRP climbs back to the positive zone, a significant gain should be expected to the 2800SAT level. A further gain above the channel could lead to intense buying as 3400SAT resistance would be a key target for buyers. Also, the 3760SAT level could resurface.
Disclaimer: Information found on CryptoPotato is those of writers quoted. It does not represent the opinions of CryptoPotato on whether to buy, sell, or hold any investments. You are advised to conduct your own research before making any investment decisions. Use provided information at your own risk. See Disclaimer for more information.
Cryptocurrency charts by TradingView.
Technical analysis tools by Coinigy.
The post appeared first on CryptoPotato


