- Despite moving in the opposite direction, Ripple’s XRP maintains channel pattern across its trading pairs.
- XRP is bullish against the US Dollar but waiting to make or break the channel.
- Against Bitcoin, XRP is losing momentum as the 2512SAT level is under bearish threat.
XRP/USD: XRP Finds Slight Support At $0.23, Can This Level Hold?
Key Support Levels: $0.21, $0.20, $0.186
Key Resistance Levels: $0.251, $0.26, $0.28
Starting with a positive move in the year 2020, XRP has witnessed a significant increase against the US Dollar, amounting to about 38% growth over the past weeks. This has allowed buyers to take control of the market on a short-term outlook. At the same time, XRP is slowly leaving the long-term bearish zone.

XRPUSD, 4H Chart – January 20
Short-Term Price Analysis
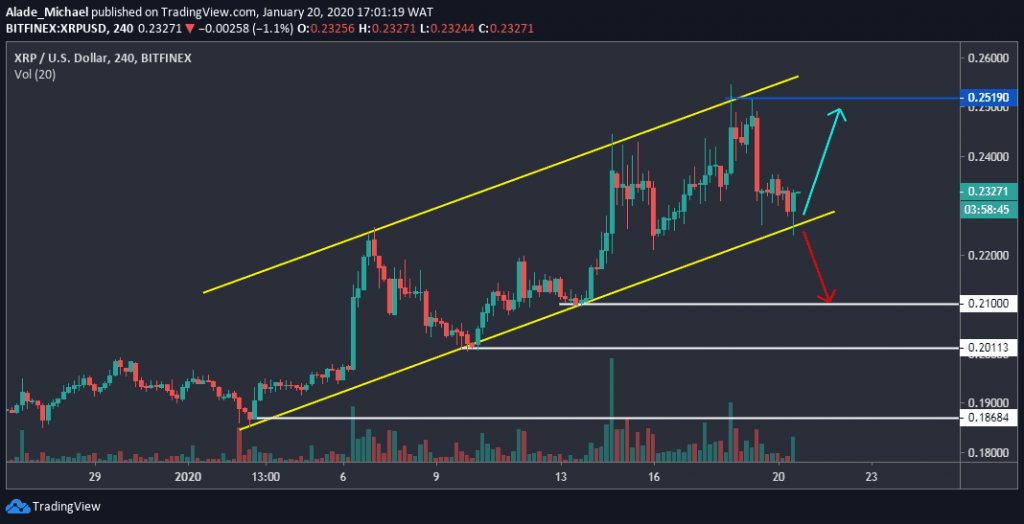
Looking at the 4-hours chart, we can see that the recent increase is shaped in a rising channel pattern. At the moment, the XRP/USD is trading around the lower boundary of the channel. After testing the trend’s support, the price bounced a bit to where XRP is now hovering around $0.232.
If XRP continues to go higher, the price is expected to reach the upper boundary of the channel – $0.251 resistance. The market may further hit $0.26 and $0.27 resistance if the buyers keep pushing. In case XRP breaks below this channel boundary, we may see a drop to $0.21 support, followed by $0.20 and perhaps $0.186 – the December 2019 low. As of now, XRP is still bullish. We may need to wait for a clear bounce or break before joining the next setups.
XRP/BTC: XRP Continues To Drop in a Two-Month Channel Pattern
Key Support Levels: 2512SAT, 2400SAT, 2300SAT
Key Resistance Levels: 3082SAT, 3321SAT, 3738SAT
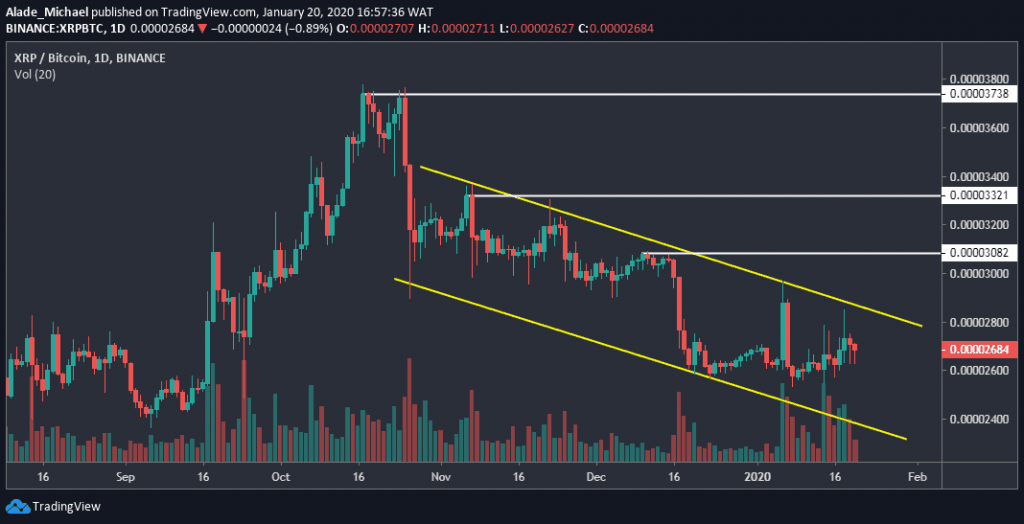
Against Bitcoin, XRP is following a bearish sentiment since its price peaked around 3800 Satoshi in late October 2019. Unlike the US pair that carves a rising channel, the third-largest cryptocurrency is maintaining a descending channel pattern against BTC. From a technical standpoint, the price of XRP is still much likely to fall for a while before recovering.

XRPBTC, Daily Chart – January 20
Short-Term Price Analysis
The daily chart for XRP shows that the sellers are still pretty present in the market. It’s obvious on the channel that XRP has been losing momentum for the past two months. As it appeared now, the bears are footing more reactions as the 2512SAT level could be exposed to a heavy selling pressure soon. If they overcome this mentioned level, new support could surface at 2400SAT and even 2300SAT – right on the channel’s lower boundary.
Meanwhile, a breakout may occur if the buyers display a lot of commitment. Should such a scenario play out; XRP might reclaim 3082SAT and 3321SAT. Notable gains above these levels would provide more buying opportunity to 3738SAT – reclaiming the October 2019 high. Regardless of the above, the bearish trend is still valid. So, we could XRP/BTC pair to continue dropping until it finds a strong reversal point.
Disclaimer: Information found on CryptoPotato is those of writers quoted. It does not represent the opinions of CryptoPotato on whether to buy, sell, or hold any investments. You are advised to conduct your own research before making any investment decisions. Use provided information at your own risk. See Disclaimer for more information.
Cryptocurrency charts by TradingView.
Technical analysis tools by Coinigy.
The post appeared first on CryptoPotato


