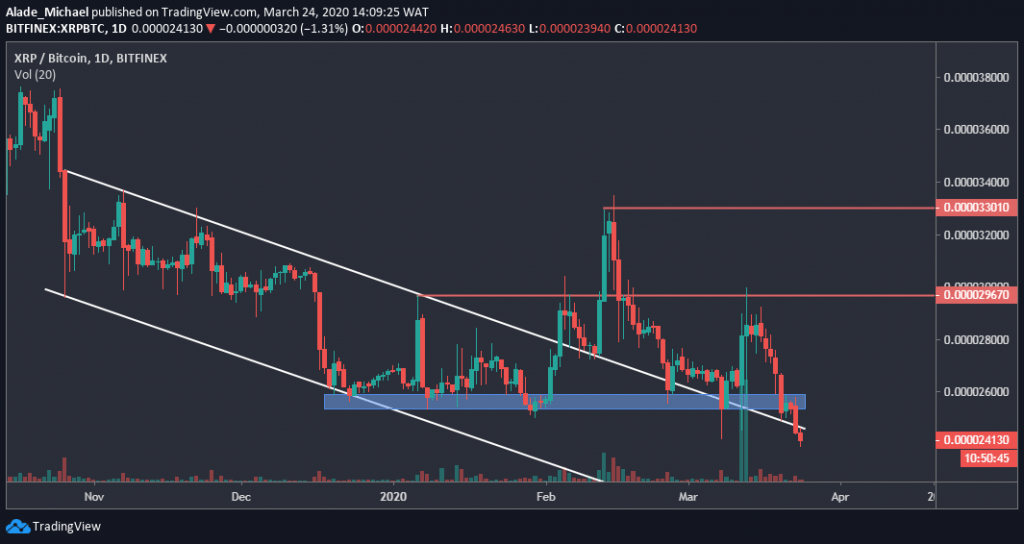
- The latest break below the three-month support could send Ripple to 2000 SAT level against Bitcoin
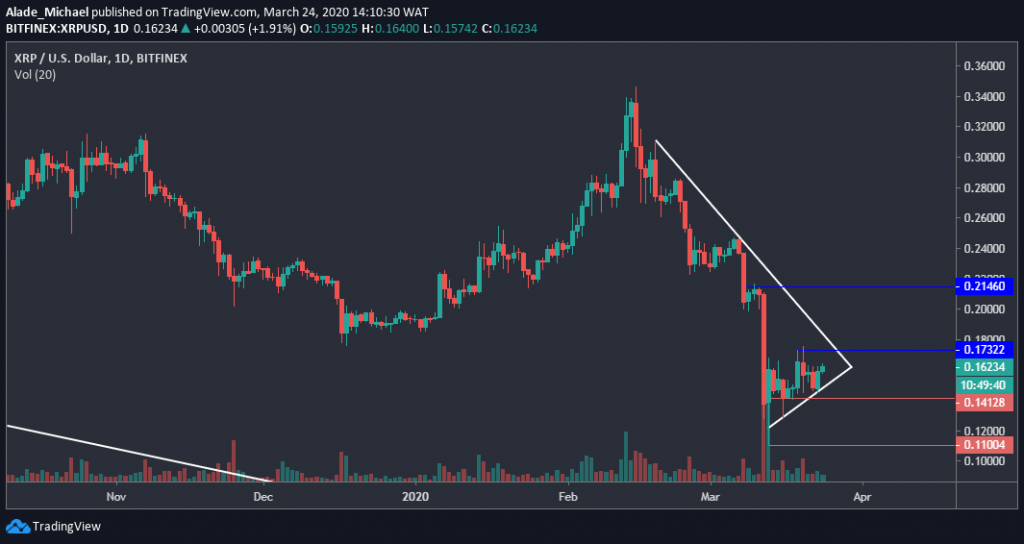
- Ripple needs to climb above the triangle’s resistance ($0.173) before considering a strong bullish price action.
- Across trading pairs, XRP failed to maintain correlation following the recent crash as price now moves in the opposite direction.
XRP/USD: Ripple Looking For Breakout
Key Resistance Levels: $0.173, $0.214
Key Support Levels: $0.141, $0.11

After recovering nicely in the middle of the month, Ripple remained in a consolidation mode, finding it difficult to break above $0.174.
However, the market has made a series of higher lows around $0.11 (monthly low), followed by $0.13 (last week’s low) and $0.15 (this week’s low), respectively. This shows that a healthy bullish pattern is forming.
Following 5.2% gains overnight, Ripple is now trading around $0.162 against the US Dollar. Meanwhile, the price is still inside a triangle on the daily chart. There’s a need for a triangle break up before we can validate a true bullish price action.
Ripple Short-Term Price Analysis
As soon as Ripple breaks above the triangle, along with the immediate blue resistance line of $0.173, the next price target for the bulls lies at $0.214 – which is the second blue line.
If the price gets rejected again, in the opposite direction, there are many supports to watch, but the major support here is $0.141, which is marked red beneath the triangle.
In case this support fails to hold, the price is likely to roll back to $0.11 support, from where Ripple started to recover a few days back.
XRP/BTC: Ripple Broke Down Crucial Support
Key Resistance Levels: 2600 SAT, 2967 SAT, 3300 SAT
Key Support Levels: 2200 SAT, 2100 SAT, 2000 SAT

While Ripple slowly regains momentum against the US dollar, the price is consistently dropping against Bitcoin for the past 12 days now.
In fact, the XRPBTC pair has broken beneath significant support of 2600 SAT – the blue area, which was holding price actions for the past three months now.
As we can see on the daily chart, Ripple is slowly rolling back inside the descending channel that got broken in February. From a technical perspective, we can say the bears are back in this market. However, this bearish scenario is likely to get worse if XRP keeps losing momentum.
The only condition for recovery is if buyers can push the price back significantly above the 2600 SAT level. If not, the bearish momentum could last for a while. As of now, Ripple is trading around the 2400 SAT level.
Ripple Short-Term Price Analysis
We can see that Ripple has made a 7-month decrease to 2400 SAT today, although it may create fresh low if the price continues to drop.
In case of a bearish extension, we can expect new support to come around 2200 SAT, and 2100 SAT or even lower to 2000 SAT level.
But if Ripple manages to gain strength and reclaim 2600 SAT – the crucial support-turned-resistance, the buyers would target 2967 SAT, followed by 3300 SAT resistance once again.
But with the recent price breakdown, Ripple appeared to be starting another bearish sentiment against Bitcoin.
The post Ripple Price Analysis: XRP Gaining Momentum At $0.16 But Continues To Fall Against Bitcoin appeared first on CryptoPotato.
The post appeared first on CryptoPotato


