- XRP has seen an increase of 4.25% this week as it reaches $0.23.
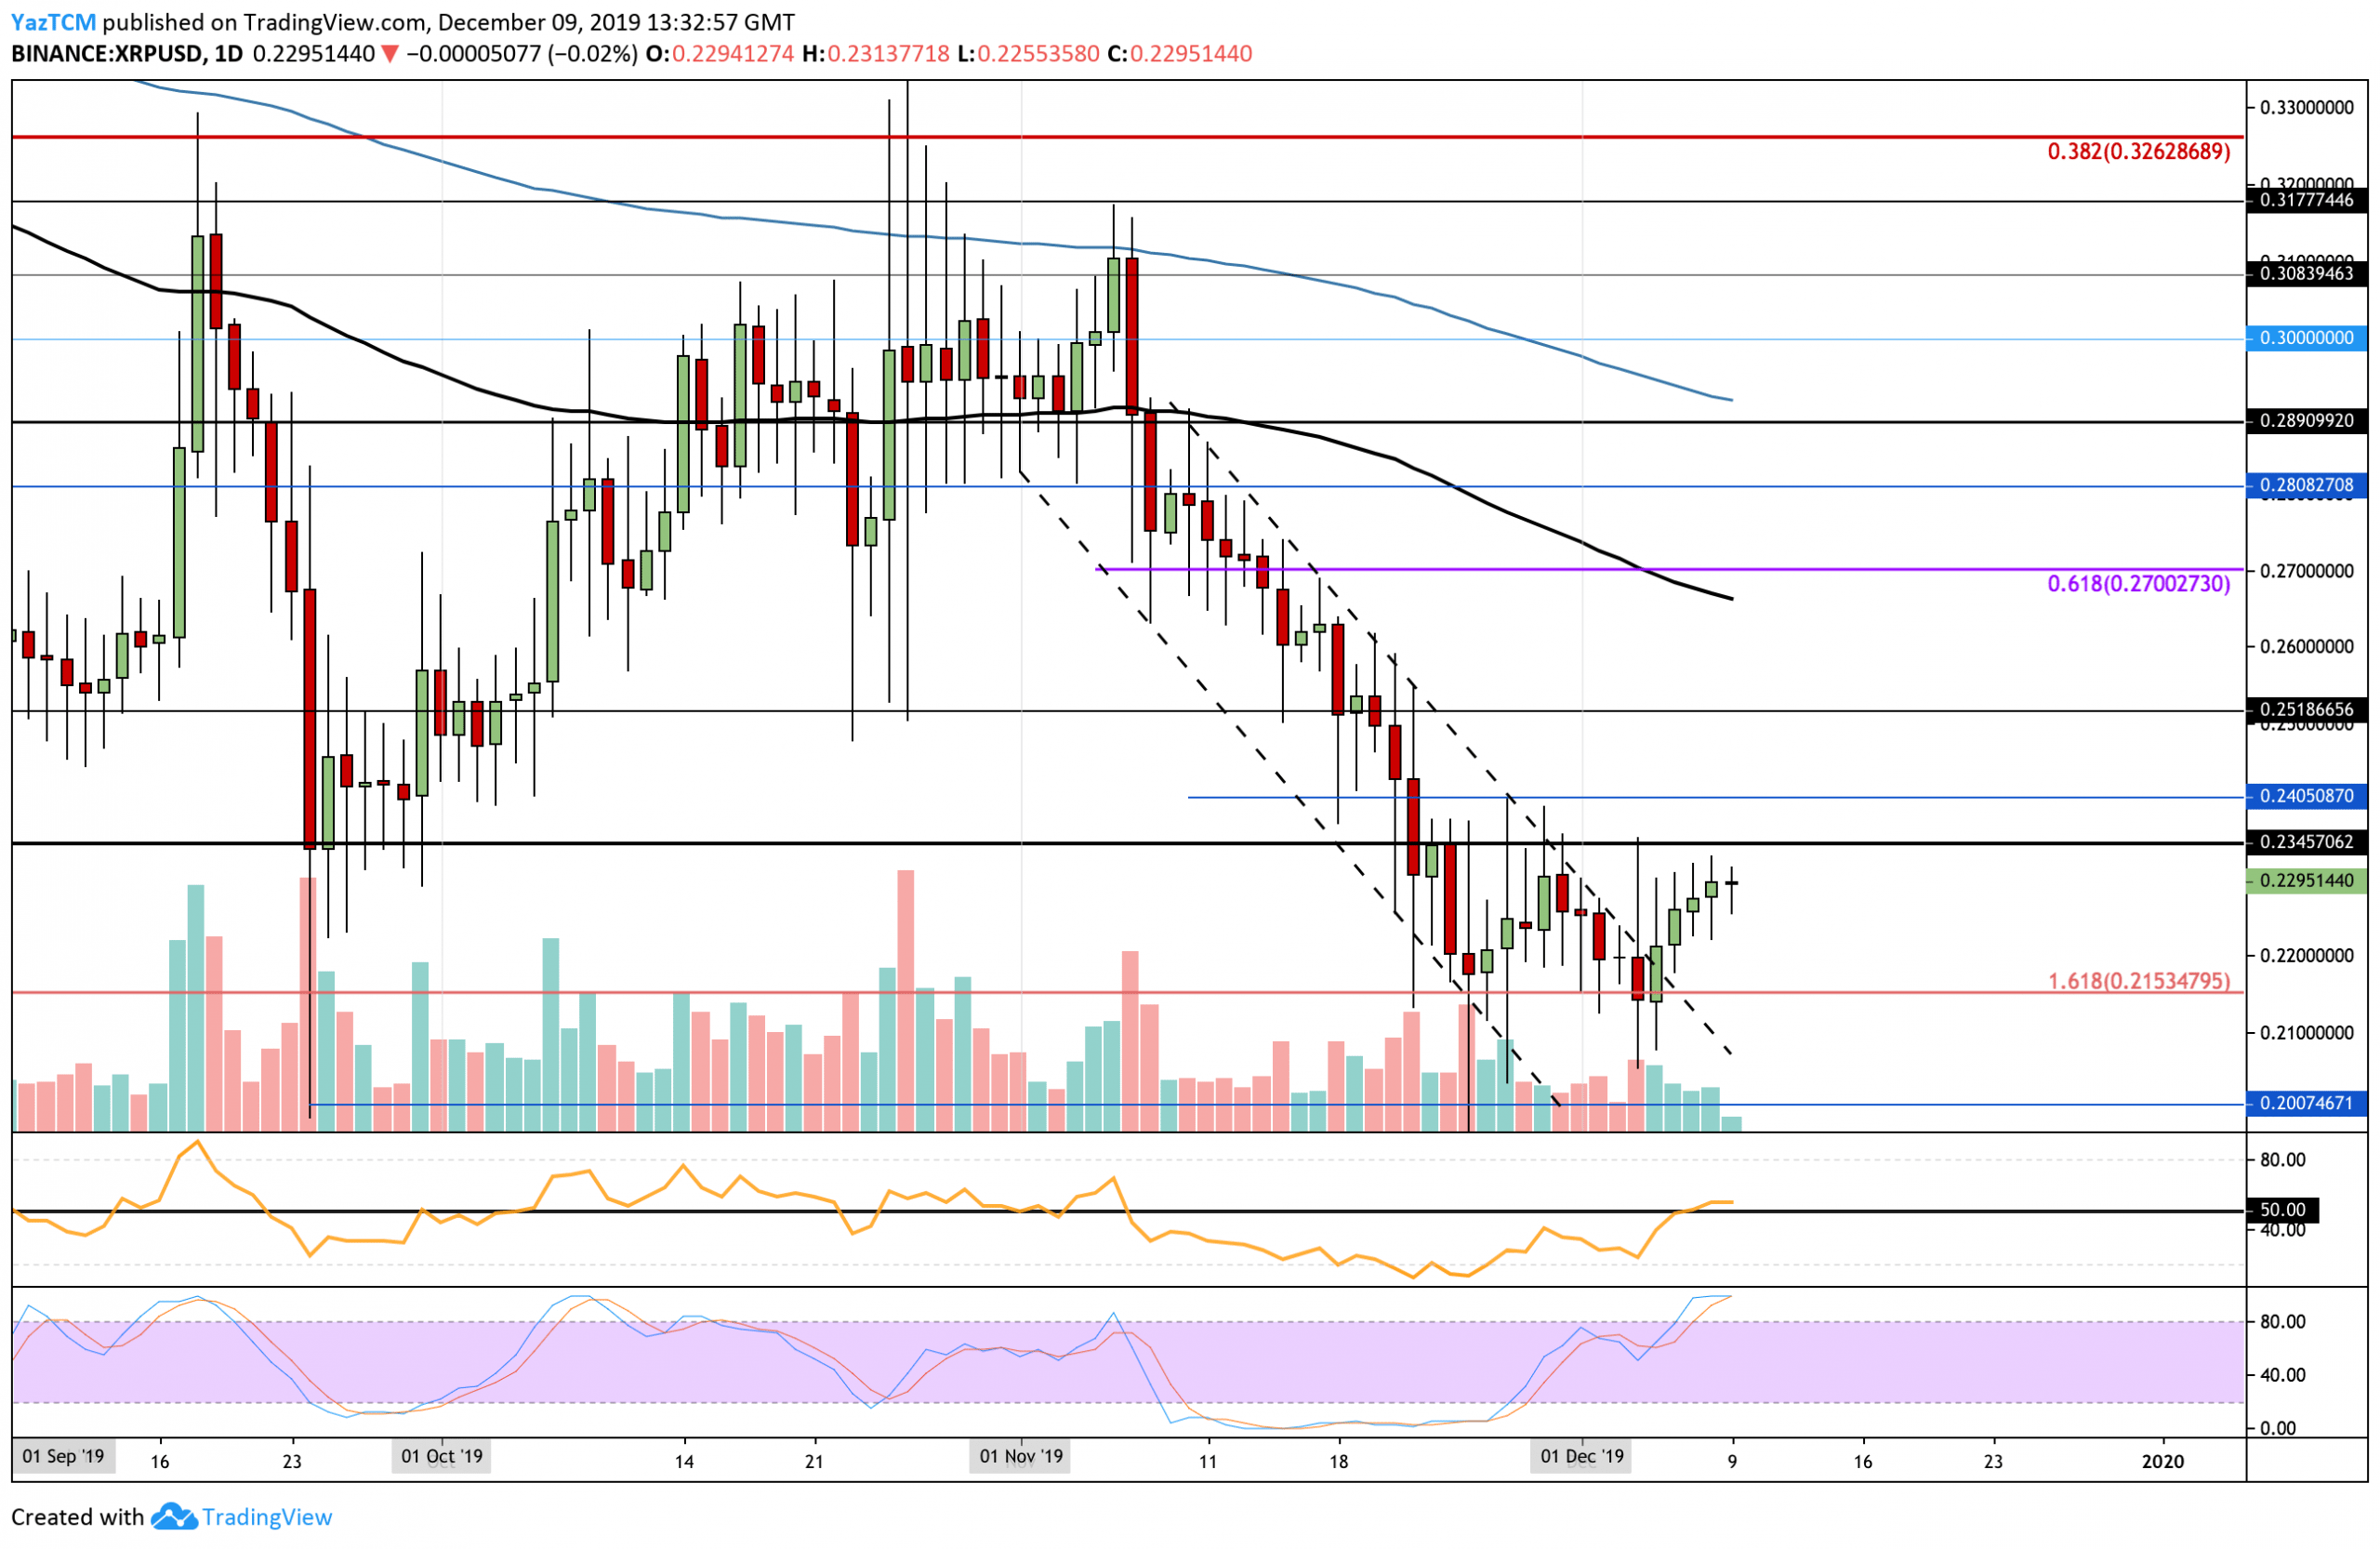
- The cryptocurrency broke above a steep descending channel that was apparent in November.
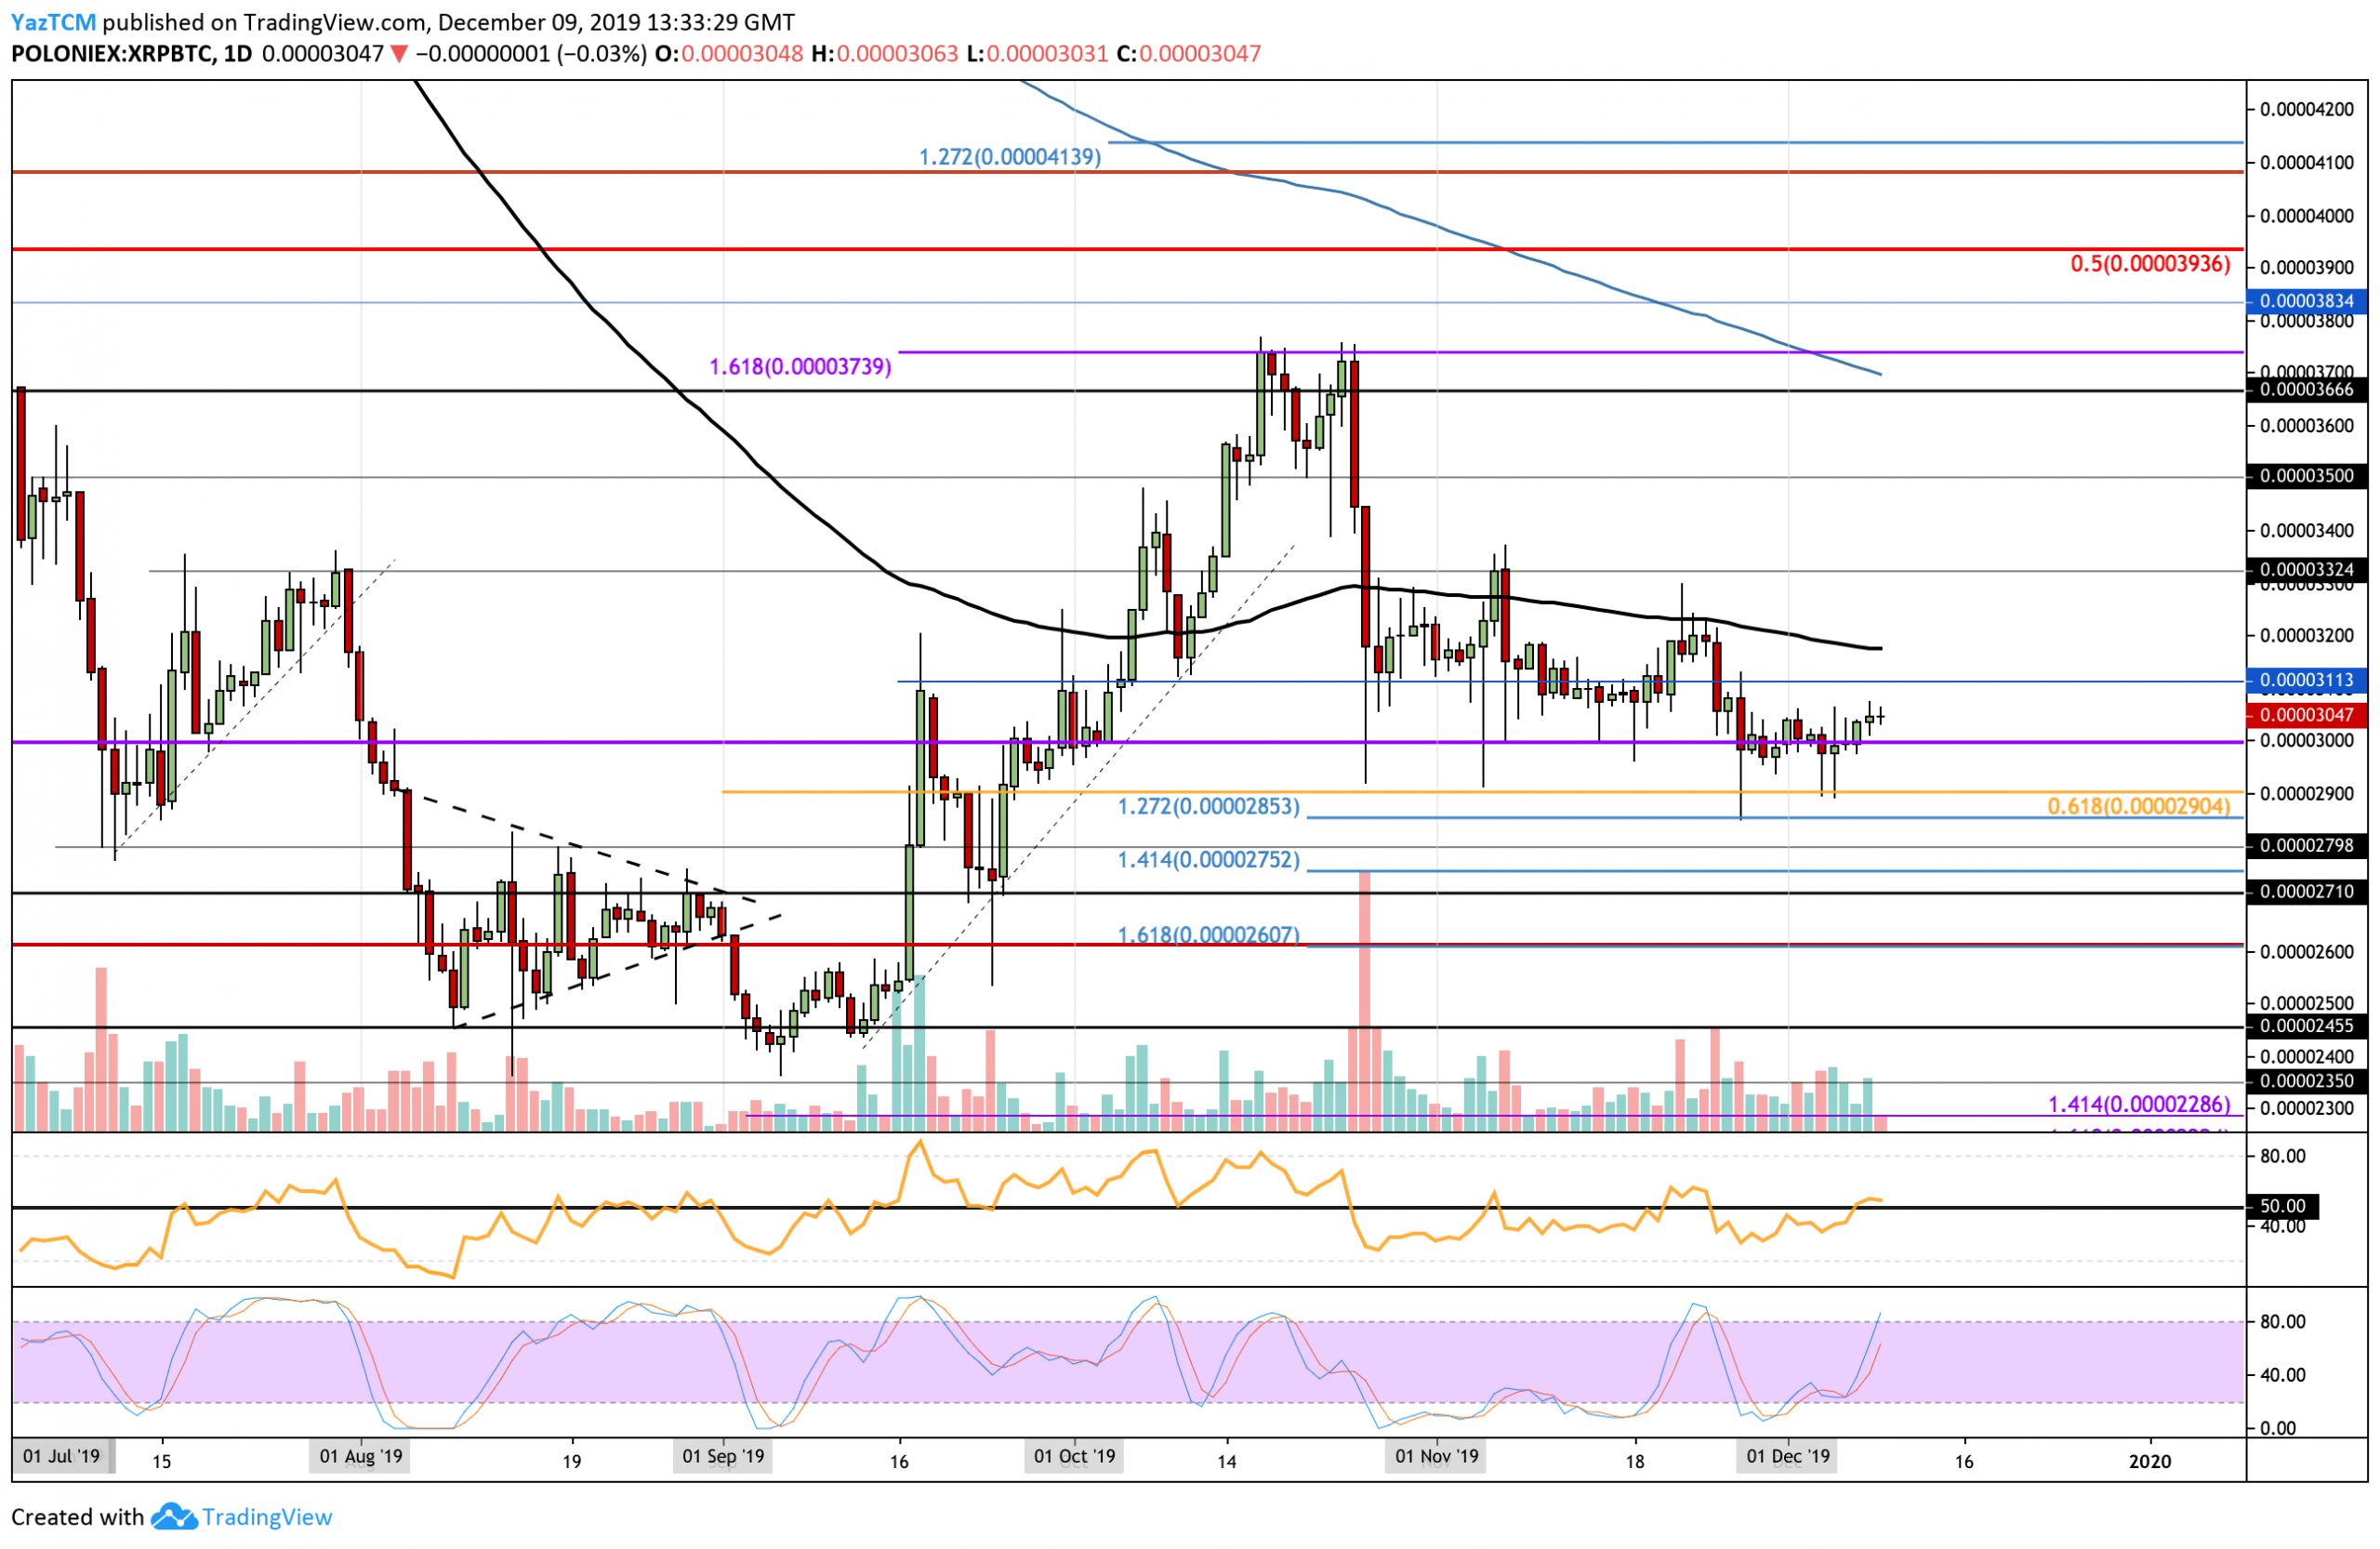
- It continues to remain above the strong 3000 SAT support against BTC.
Key Support & Resistance Levels
Support: $0.2150, $0.20, $0.1850
Resistance: $0.2345, $0.2520, $0.27
Support: 3000 SAT, 2900 SAT, 22853 SAT
Resistance: 3200 SAT, 3325 SAT, 3500 SAT
XRP/USD: A Break Above The Descending Price Channel

The daily chart shows XRP bouncing from the strong support at $0.2150 toward the start of December. The cryptocurrency had been trapped within a steep descending price channel for the entire period of November and broke above this after rebounding at $0.2150.
XRP now faces strong resistance at $0.2345 and must break above $0.24 to see an intermediate bullish run. The support at $0.2150 can be expected to hold moving forward, but a break below would turn the market bearish.
XRP Short Term Price Prediction
If the buyers continue to push XRP above $0.2345, immediate higher resistance is expected at $0.24. Above this, resistance is located at $0.2520, $26.50 (100-days EMA), and $0.27 (bearish .618 Fib Retracement). On the other hand, if the sellers push the market lower, support is expected at $0.215. Beneath this, support lies at $0.205, $0.20, and $0.185.
The RSI is trading at the 50 level which shows indecision within the market. However, the Stochastic RSI is in overbought conditions and is primed for a bearish crossover signal which would send the market lower.
XRP/BTC: Stron Above 3000 SAT

Against BTC, XRP continues to remain above the 3000 SAT support as it trades at 3050 SAT.
For the cryptocurrency to turn bullish against BTC, XRP must break above the resistance at 3325 SAT (November highs). If it was to fall beneath the 3000 SAT support, the market would be considered as bearish.
XRP Short Term Price Prediction
Looking ahead, if the buyers push the market higher we can expect immediate strong resistance at 3115 SAT and 3185 SAT (100-days EMA). Above this, resistance lies at 3325 SAT and 3500 SAT. Alternatively, toward the downside, initial support lies at 3000 SAT. Beneath this, support lies at 2900 SAT (.618 Fib Retracement), 2850 SAT, and 2752 SAT.
The RSI has poked above the 50 level to show the bulls are weakly in charge of the momentum. Furthermore, the Stocahstic RSI recently produced a bullish crossover signal which helped XRP bounce higher from the 3000 SAT support.
Disclaimer: Information found on CryptoPotato is those of writers quoted. It does not represent the opinions of CryptoPotato on whether to buy, sell, or hold any investments. You are advised to conduct your own research before making any investment decisions. Use provided information at your own risk. See Disclaimer for more information.
Cryptocurrency charts by TradingView.
Technical analysis tools by Coinigy.
You might also like:
The post appeared first on CryptoPotato


