After overheating for months to pie-in-the-sky valuations, the stock markets are finally cooling down. Coronavirus may have been the catalyst, but market analysts worth their salt knew the correction was looming.
The Buffett Indicator (the total market cap of the US stock market divided by US GDP) has surpassed the pre-Great Recession and pre-Dot Com bubble pop levels for weeks. Corporate multiples like forwarding stock price to earnings ratio haven’t been promising either.
And then there were the record levels of corporate, consumer, and government debt amid massive balance sheet expansion by the Federal Reserve since Sept 2019. That was all proof enough the bull market was a mirage.
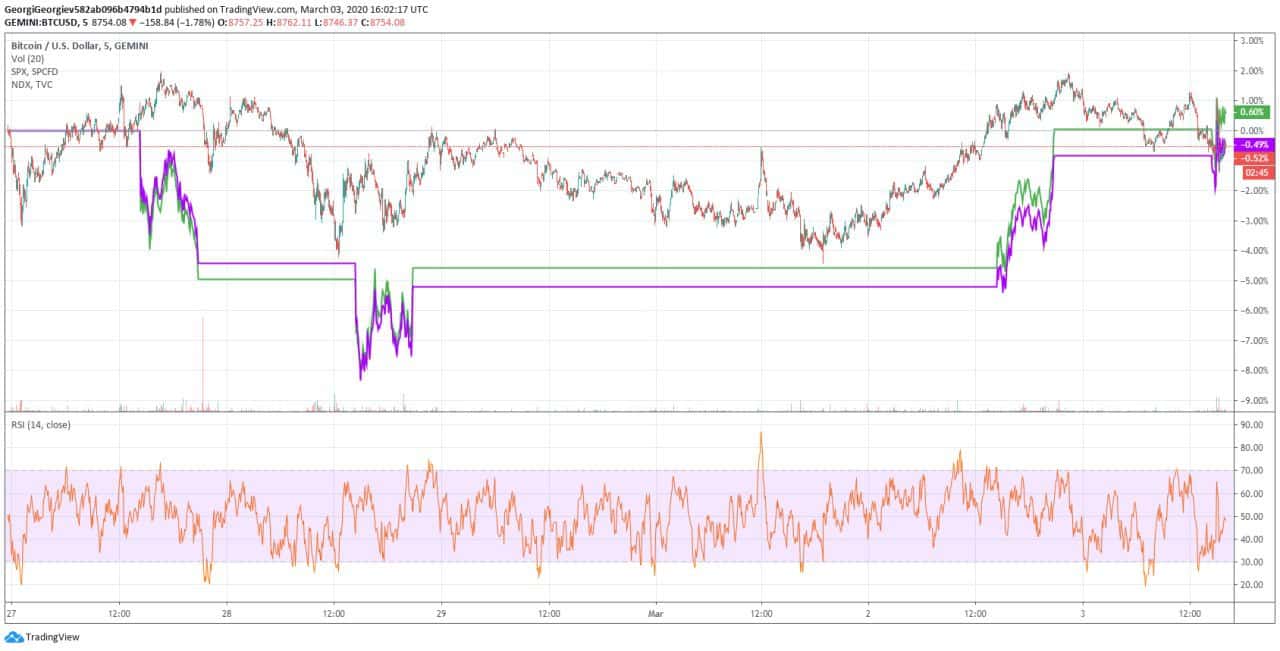
But as stock markets’ values fell from the sky in the swiftest, most brutal correction in history by some measures, the Bitcoin price tracked with equities. Why is that?
After all, Bitcoin has seemed to display more non-correlated price movements over its short history. Does the digital coin no longer merit its proponents’ pitch as a global macro hedge in times of economic distress?
Where Does Bitcoin Fit In?
Bitcoin is only ten years old, but in a short period, it changed the world. The Bitcoin network is a remarkable proof of many essential concepts. For instance, it’s possible to create something digital that there is only one that cannot be made into endless copies.

That alone should earn Satoshi Nakamoto a Nobel Memorial Prize in Economic Sciences. Also, of course, that open-source, Bitcoin has proven that peer-to-peer banking is more than just possible. The digital marketplace has made it a highly valued and sought after commodity.
As Bitcoin emerged in a remarkable tour de force, financial analysts have tried to map it onto what they know. And the cryptocurrency’s proponents have also built narratives around it to propagandize and spur adoption. Is Bitcoin an uncorrelated, safe-haven asset like gold? Or is it a risk asset like NASDAQ stocks in the late 1990s and early 2000s? Let’s back up a step: What’s a non-correlated asset?
Correlated and Non Correlated AssetsA non-correlated asset is one that does not consistently move in the same direction or the opposite direction as another asset. From Fidelity Investments’ Pros Guide to Diversification:
“Correlation is a number from -100% to 100% that is computed using historical returns. A correlation of 50% between two stocks, for example, means that in the past when the return on one stock was going up, then about 50% of the time they return on the other stock was going up, too. A correlation of -70% tells you that historically, 70% of the time they were moving in opposite directions — one stock was going up, and the other was going down.”
Non-correlation with traditional securities like bonds or the stock market is not necessarily a property of a safe haven asset. In fact, a safe haven tends to have an inverse correlation with these assets.
At least it certainly does when they’re under bear market’s conditions. Gold is the traditional safe-haven asset. When people are more afraid that they might not be able to get their money back from the financial system, they store up gold. Because it’s a bearer instrument, they can keep on hand. It has instrumental value as money and for industrial use. It’s inversely correlated with the S&P 500.
Bitcoin: Risk Asset or Safe Haven?
As for Bitcoin, this week, financial analysts are scratching their heads, wondering why it tracked with equities. Last May, during a steep stock market selloff, the Bitcoin price skyrocketed. Analysts saw confirmation in this of the cryptocurrency’s safe-haven status, with an inverse correlation to stocks.

But overall, in 2019, the crypto was uncorrelated. According to SFOX’s end of year volatility report:
“Combined with the fact that BTC is proving to be largely uncorrelated with both the S&P 500 and gold (average 30-day correlation values of -0.037 and 0.149, respectively, in the last 6 months), these data about Bitcoin’s high returns and low volatility made BTC a compelling tool for portfolio management in 2019.”
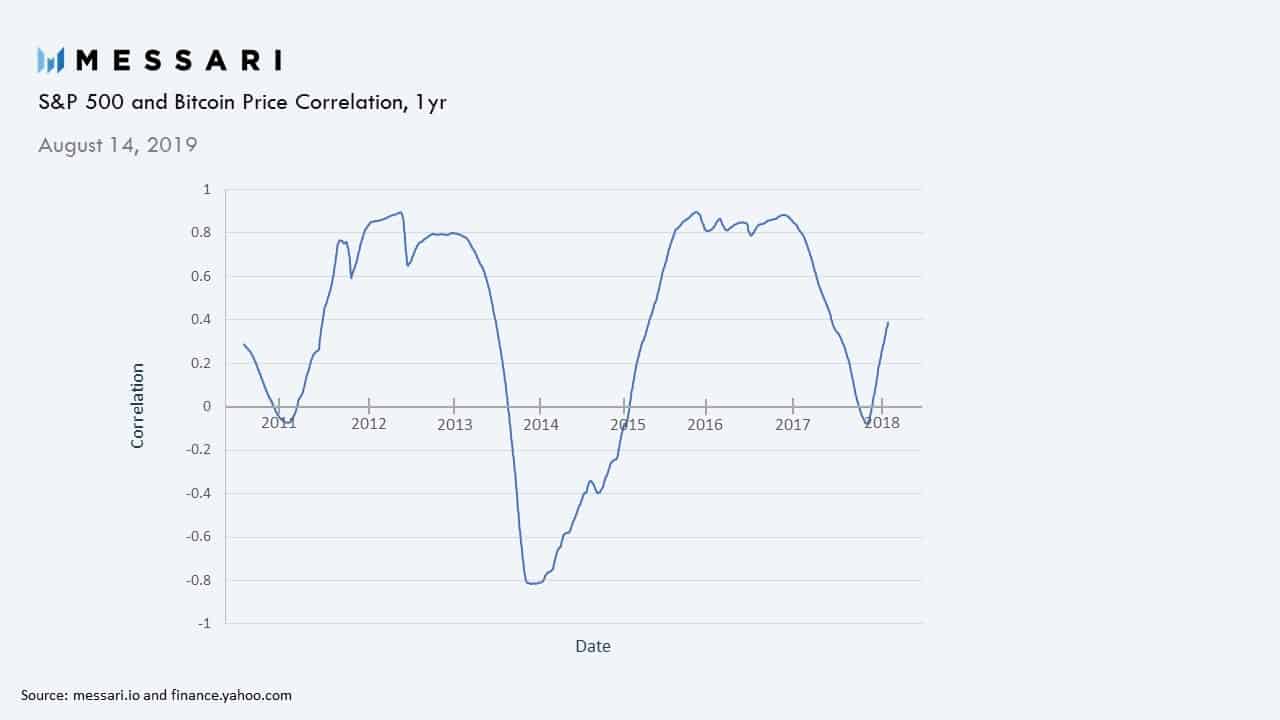
If you zoom out and look at the rolling 1-year correlation between the coin and stocks, you’ll find every couple years Bitcoin switches between very high positive correlation, very high inverse correlation, and no correlation at all. If Bitcoin is mostly non-correlated, that means as a matter of random chance, it would track with the market sometimes, as it has in Feb 2020.

Another reason for the positive correlation this month could be this:
“Analysis by DataTrek Research suggests the correlation between bitcoin and stocks is at its highest when sentiment, rather than fundamentals, is the primary driver of moves in the financial markets”
Fundamentals came crashing through months of euphoric sentiment to drive the current stock market rout. So as a result, investors going risk-off in the face of unsound economic fundamentals laid bare by threats like coronavirus, are looking at Bitcoin as they would a high-risk / high-return tech stock.
That’s because they still haven’t fundamentally grasped, or don’t yet fully trust the thesis of Bitcoin, and it’s an unblemished operational record for ten years.
The post Safe-Haven Or Not: Why Bitcoin Price Is Correlated With Wall Street Over The Past Week? appeared first on CryptoPotato.
The post appeared first on CryptoPotato


