Bitcoin’s bullish momentum was not shared by the altcoin market. Stellar Lumens was noting bearish momentum in the short-term and it could touch $0.82 over the next few trading sessions. Algorand retested a level as resistance and could be set to see further losses on the charts. Further down the crypto-ladder, Enjin Coin strengthened its southbound trend and dropped beneath its level of support.
Stellar Lumens [XLM]


Source: XLM/USD on TradingView
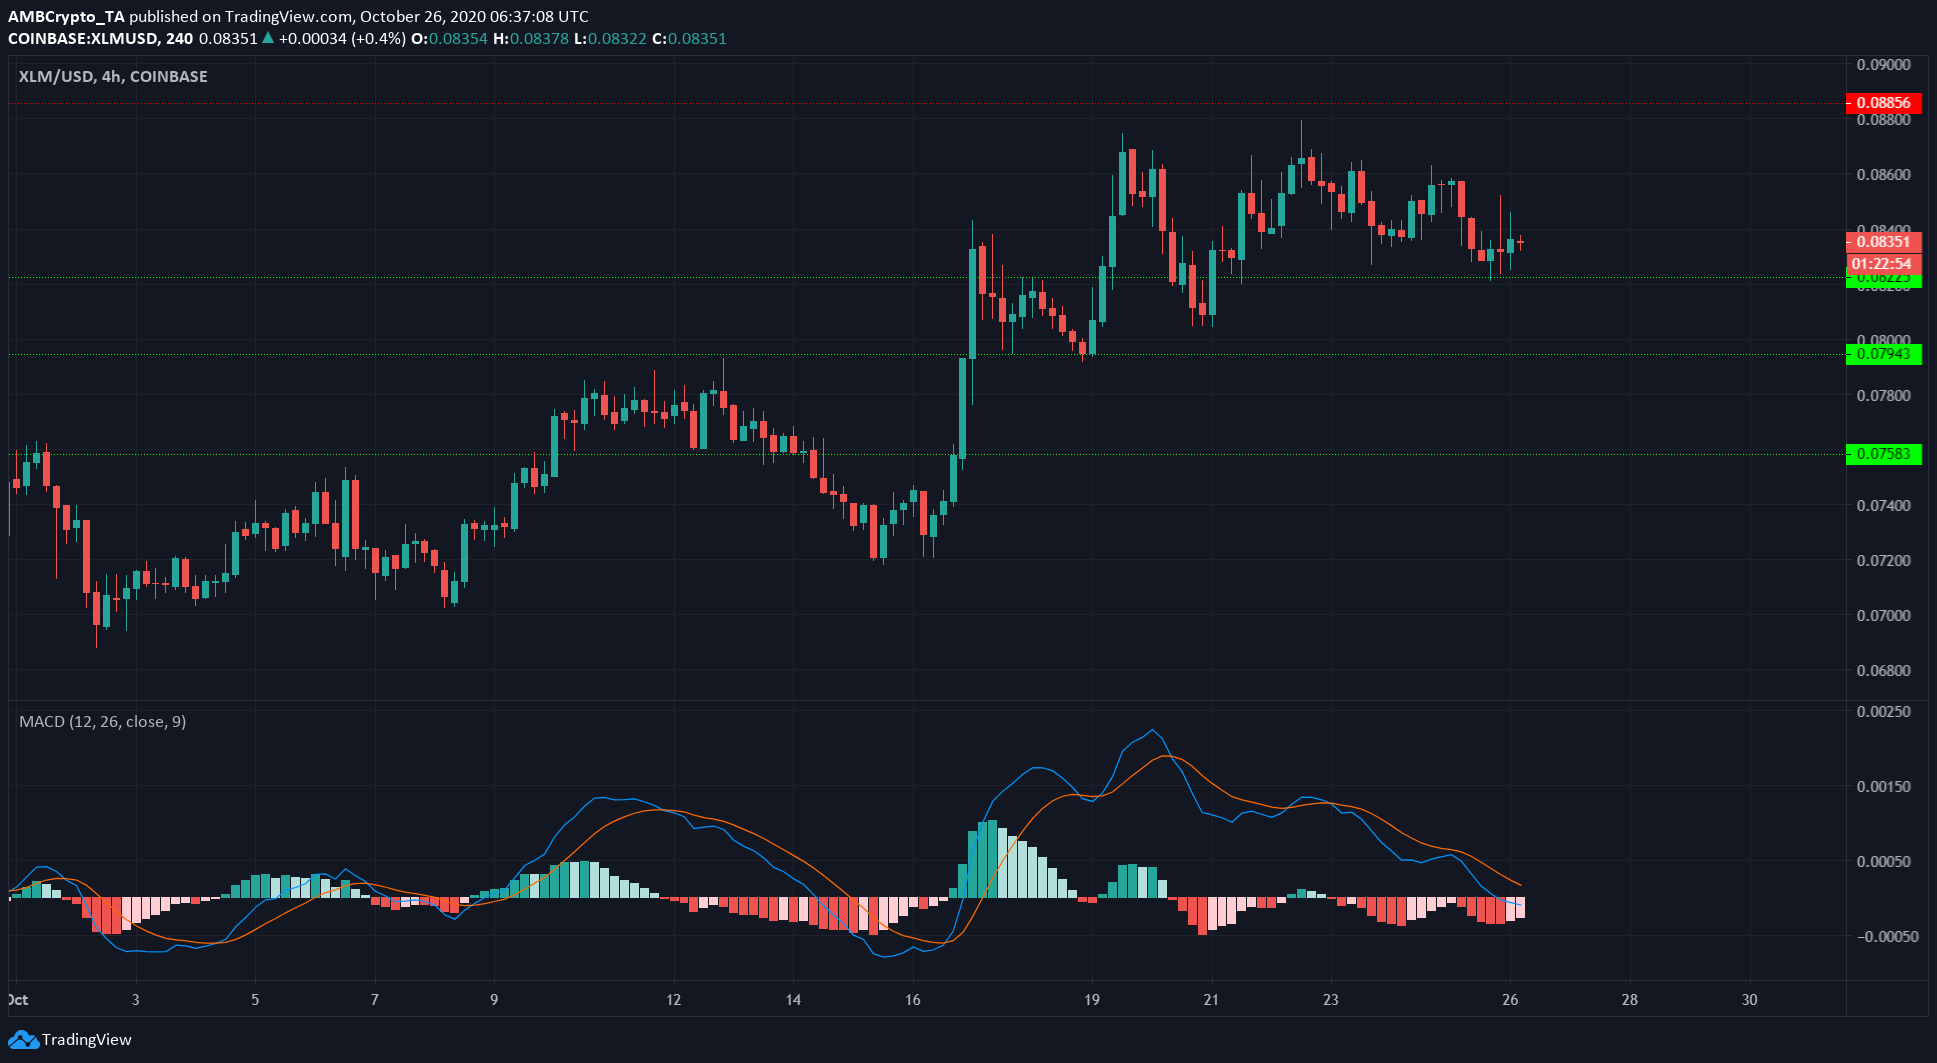
The MACD underlined the bearish momentum the crypto-asset has been noting over the past few days. In fact, it formed a bearish crossover and was moving lower on the charts as the market bullishness reversed itself.
The market bulls were able to defend $0.082 recently, but it remains to be seen if they can do so once more in the face of mounting bearishness. The cryptocurrency’s price would have to close above $0.086 before the bulls can be considered to have the upper hand in this market.
Stellar was in the news recently when it was announced that Stellar would not upgrade its public network to Protocol 14, and would directly skip to Protocol 15.
Algorand [ALGO]


Source: ALGO/USD on TradingView
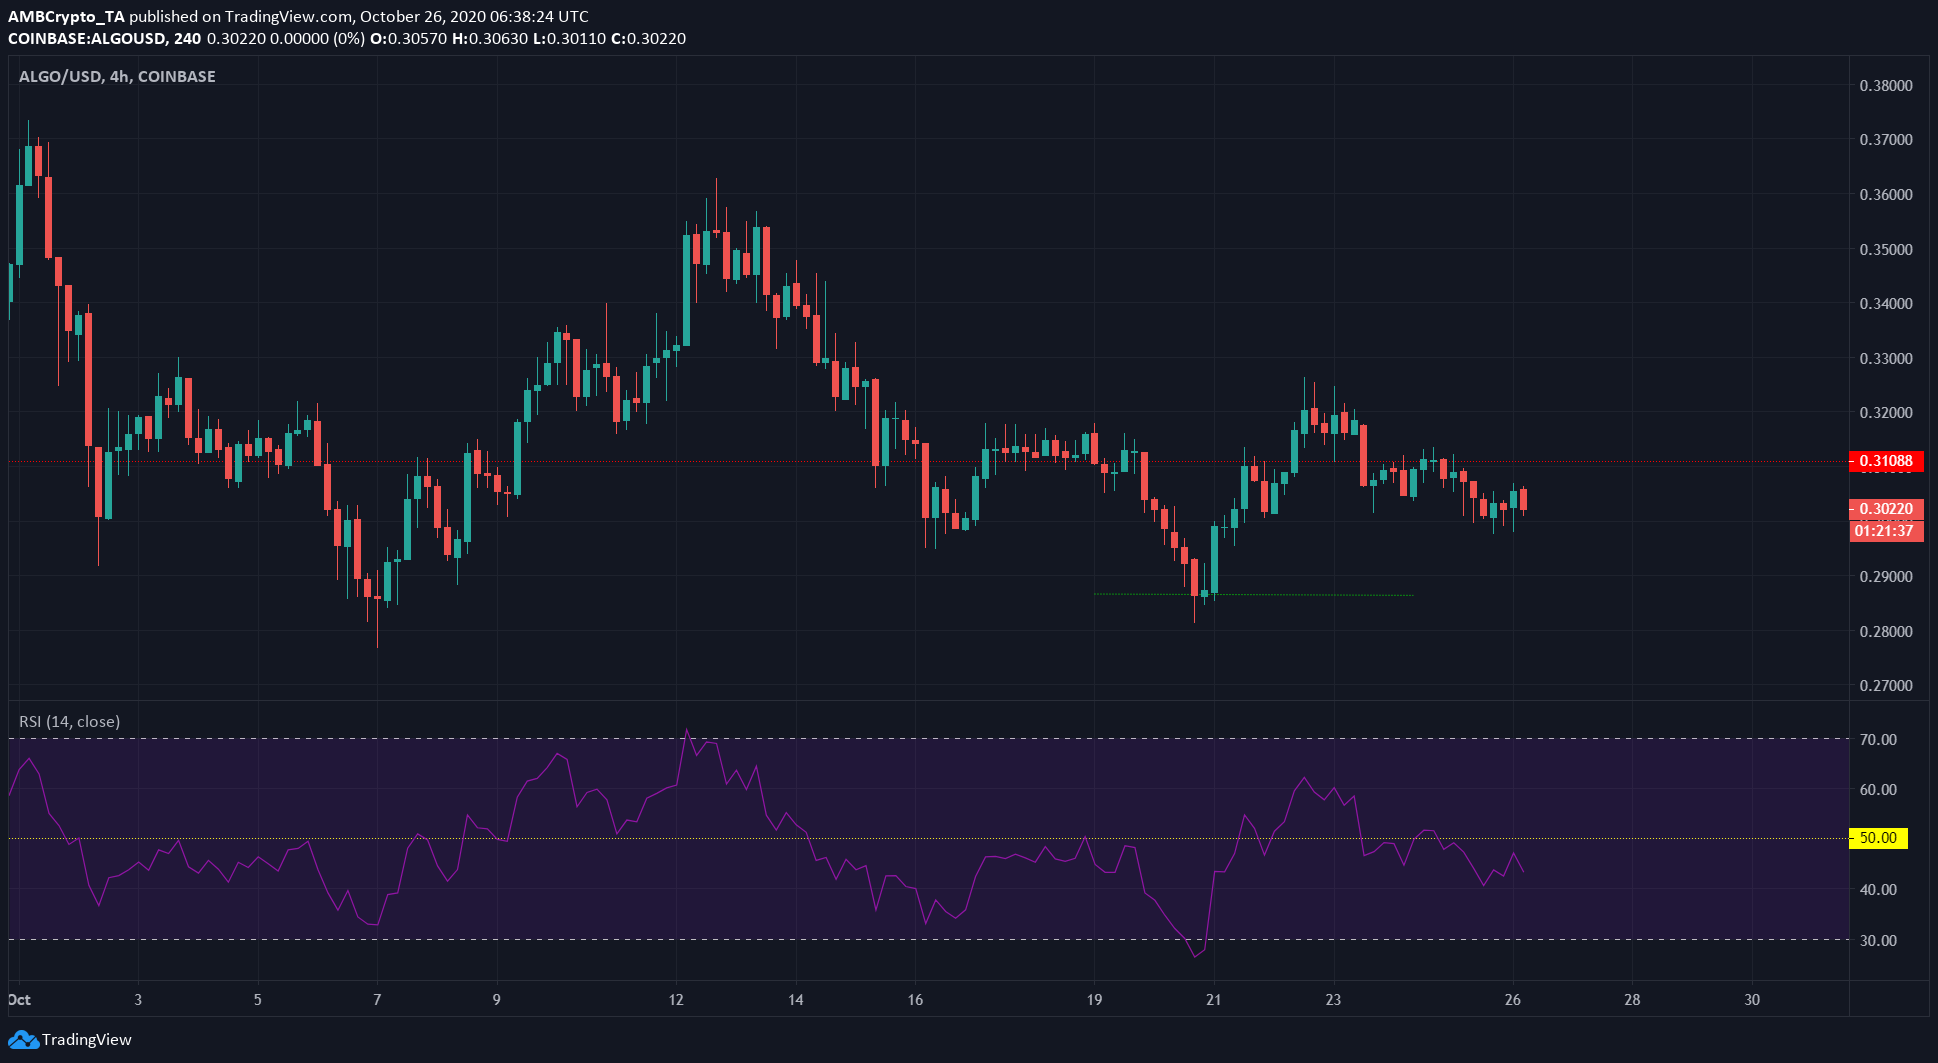
The RSI highlighted that the trend has been predominantly southbound for the crypto-asset since hitting a local high at $0.37. However, the trend could be slowing down soon.
In fact, the level at $$0.281 has been defended multiple times over the past few weeks as the downtrend lost its momentum. The market could be set to move sideways from $0.28 to $0.32 over the next few days.
A retest of $0.281 could present a buying opportunity for a scalp trade.
Enjin [ENJ]


Source: ENJ/USDT on TradingView
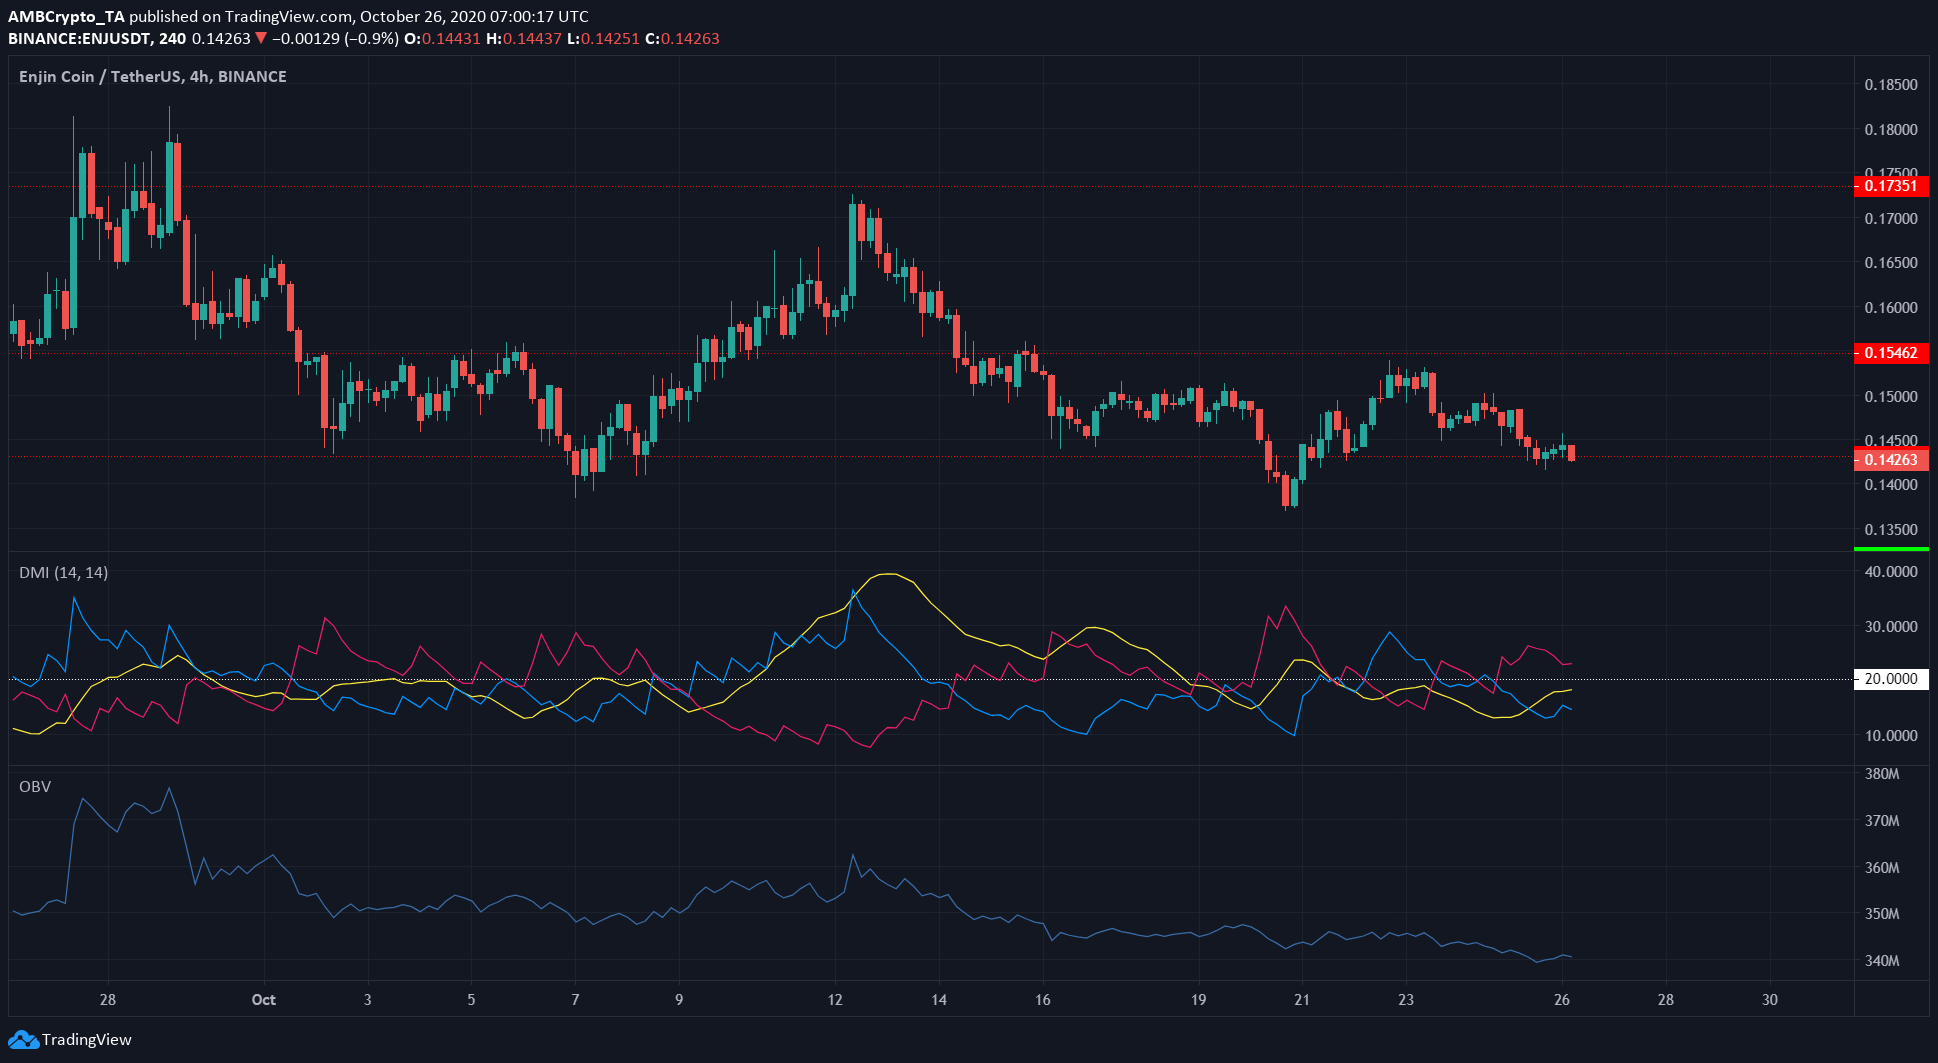
ENJ closed under $0.142 a few days ago, but the buyers were able to effect a relief rally. However, this could have been a warning signal for ENJ’s bulls.
$0.142 has been a stalwart level since early September, and if it is flipped to become a resistance level, ENJ might register more losses.
The Directional Movement Index showed that the ADX (yellow) was creeping towards 20 as the bearish trend, shown by the -DI (pink), gathered steam.
The OBV also highlighted the lack of buying volume in the market.
The post appeared first on AMBCrypto


