Stellar Lumens registered a brief uptrend on the charts, before slumping. XLM, at the time of writing, needed to resume setting higher lows to inspire any bullish confidence. EOS too lacked a definite direction, exhibiting a lack of momentum over the past few days with its bearish outlook. Further down the charts, Algorand also showed some bearish bias as it plummeted beneath its level of support and looked likely to drop further.
Stellar Lumens [XLM]


Source: XLM/USD on TradingView
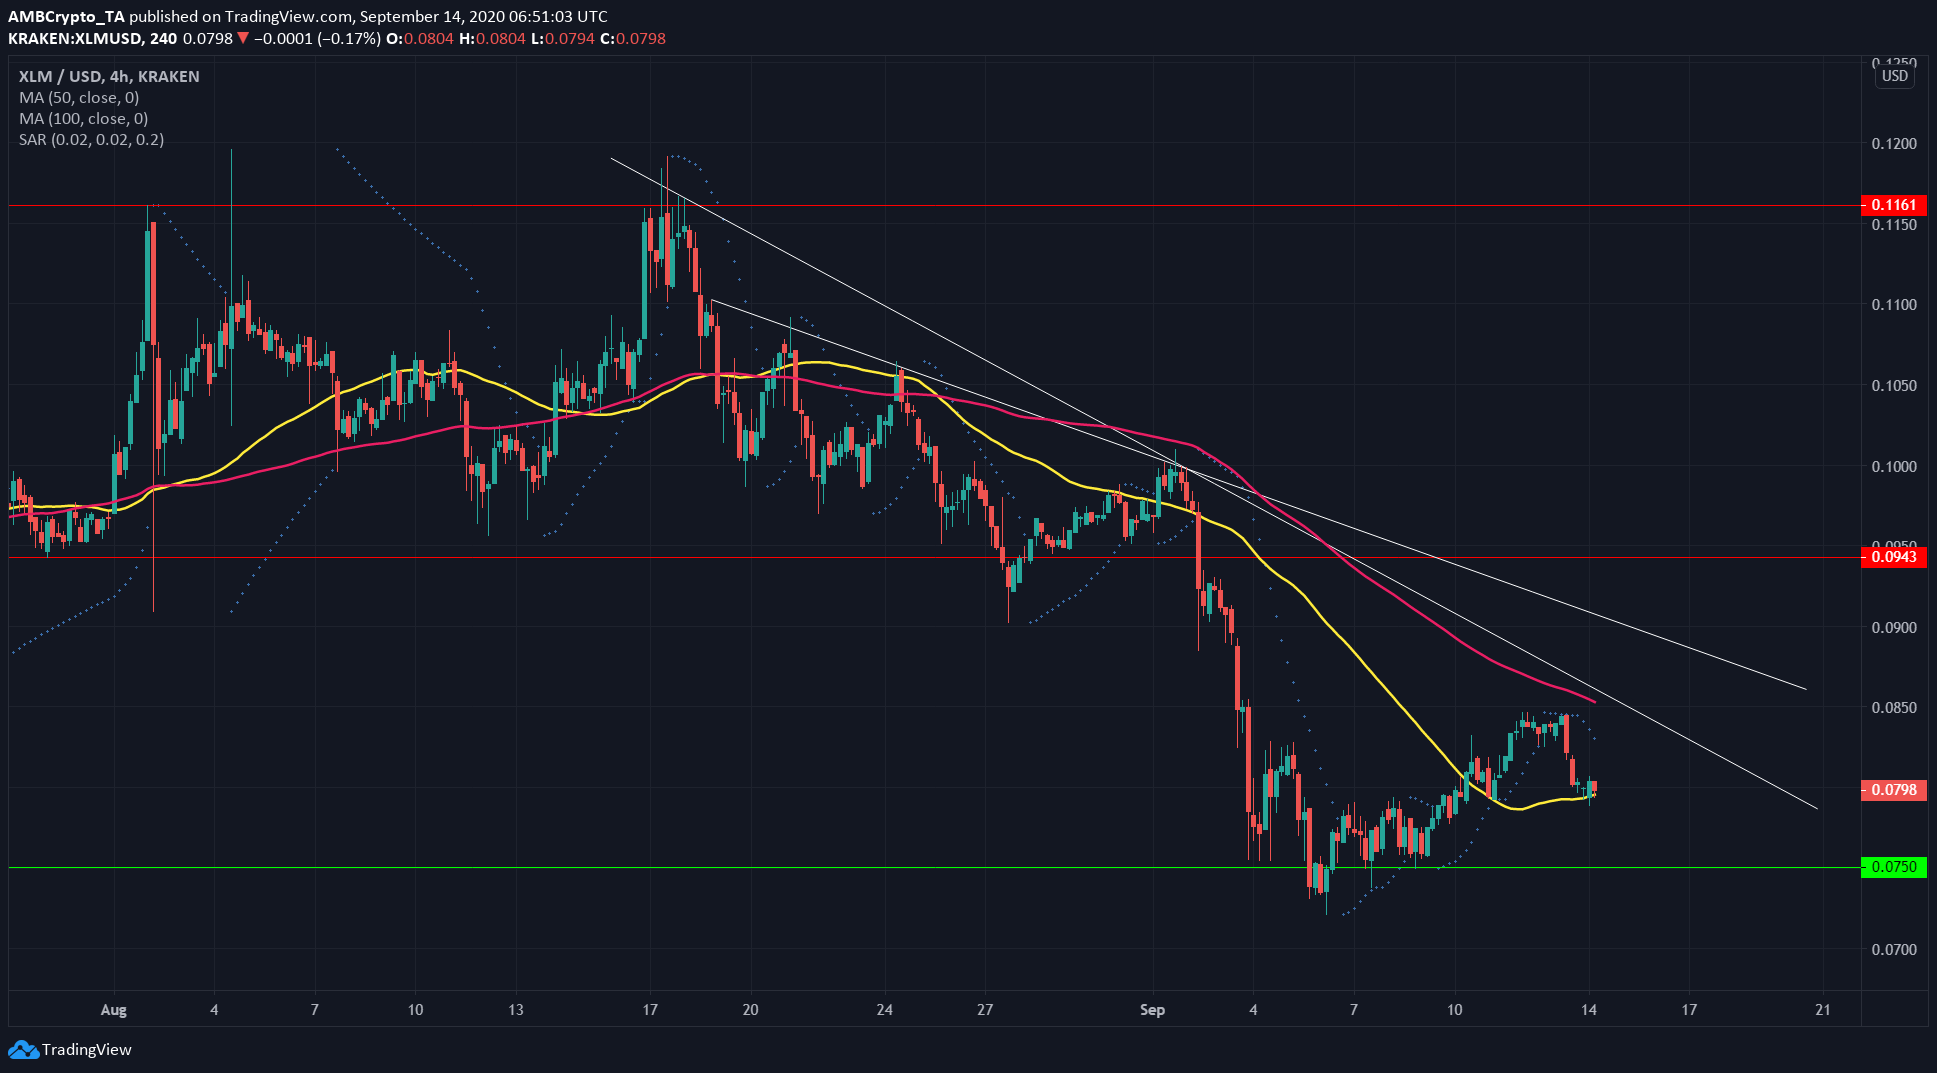
Stellar Lumens was on an uptrend over the past week, but it could not maintain its rise on the charts. At the time of writing, it had dropped from $0.84 to find support around its 50 SMA (yellow).
In fact, XLM has failed to register a higher high throughout the month after reaching a local highs of $0.115. It faced multiple levels of resistance, from its 100 SMA (pink), the down trendlines plotted from previous highs, and a significant level of resistance at $0.094.
The Parabolic SAR also gave a sell signal. Beyond the moving average, a level of support for XLM lay at $0.075.
The outlook for XLM remained bearish over the longer time-frame. In the near-term, a move above the 100 SMA might herald bullishness.
EOS


Source: EOS/USD on TradingView
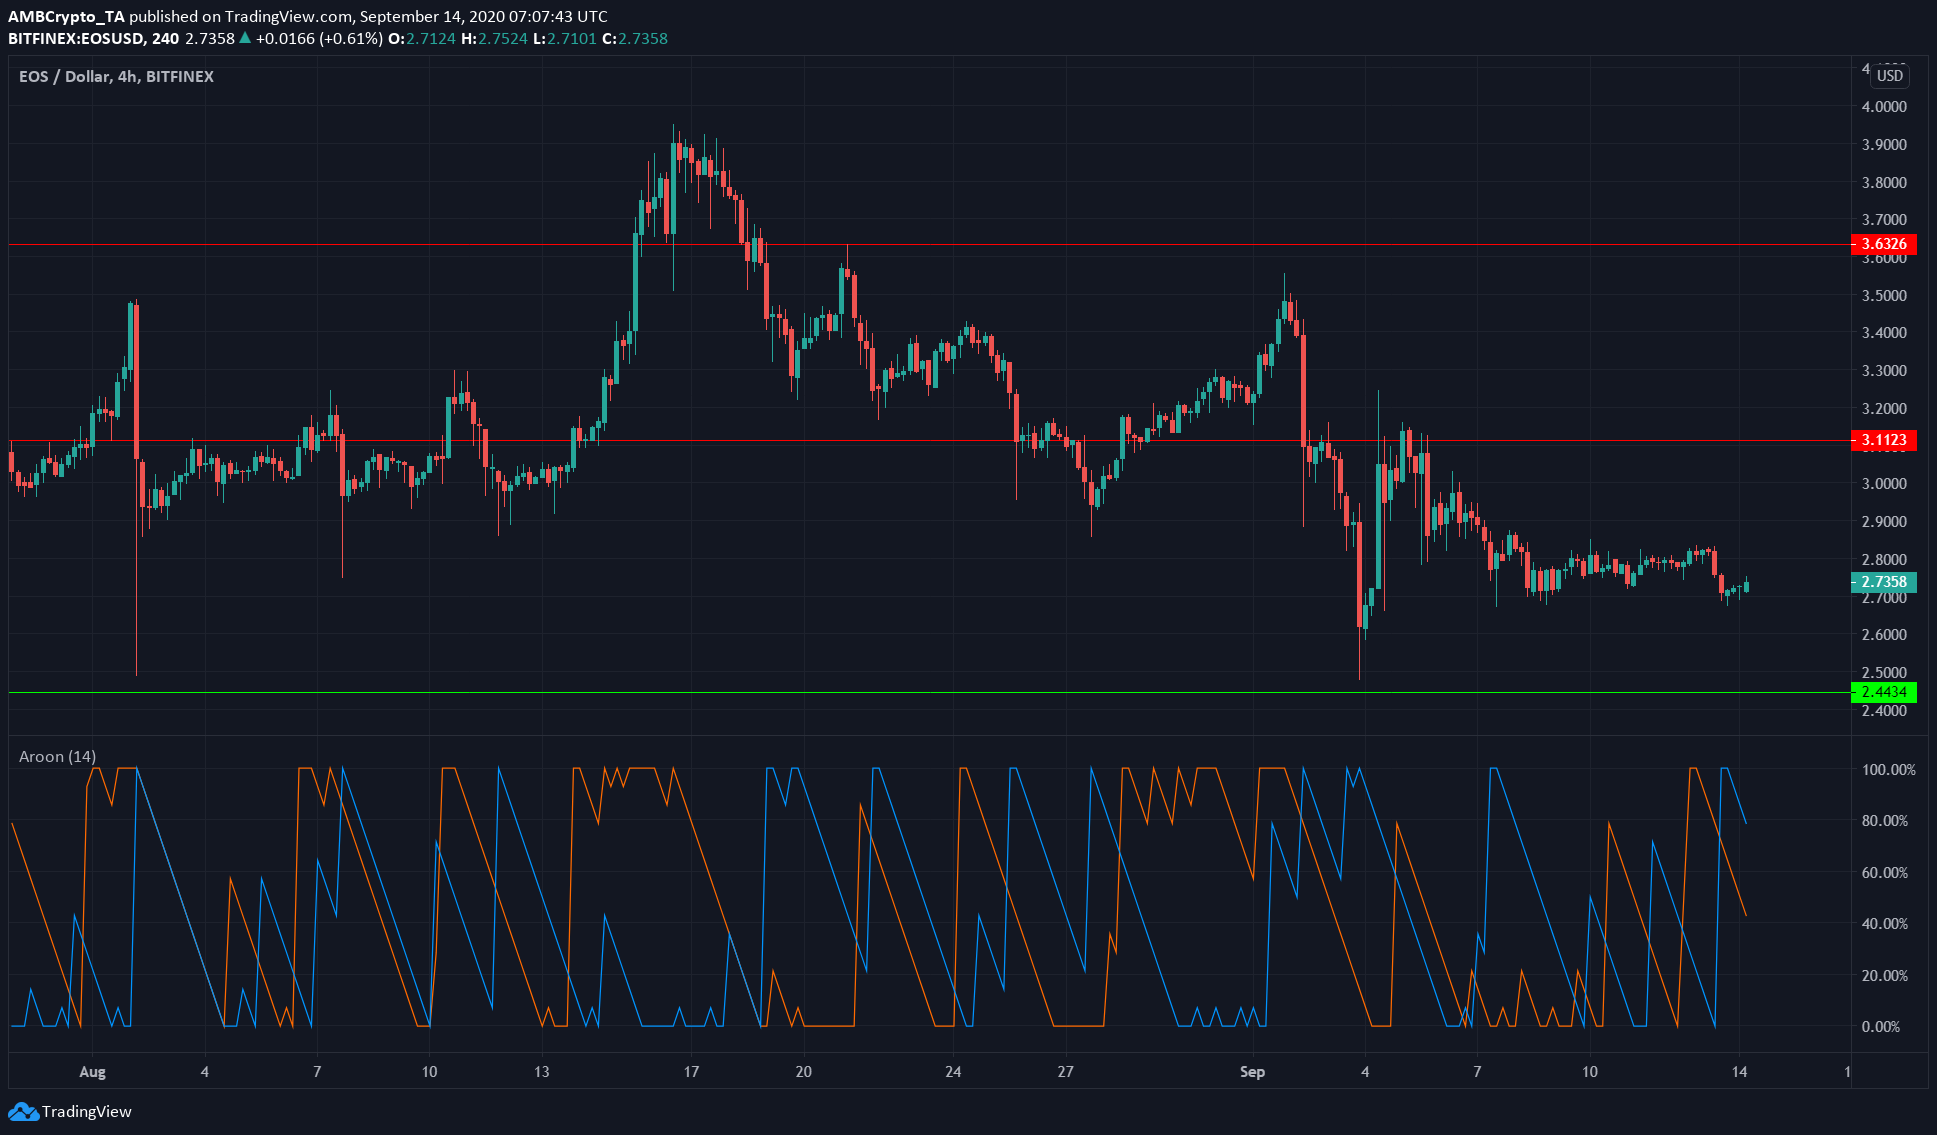
EOS showed choppiness on the charts. This was captured by the Aroon indicator as the Aroon Up (orange) and Aroon Down (blue) have criss-crossed each other multiple times since early-September.
EOS lacked a definite direction and was also trading between two important levels of resistance and support, at $3.1 and $2.4, respectively. A buy or sell opportunity might be presented as the price moves towards either level.
EOS was ranked 12th on CoinMarketCap’s charts with a market cap of $2.5 billion. Over the past week, its 24-hour trading volume was around $1.9 million. This value was only half of its average daily trading volume in the first week of September, a week that saw EOS register a steep drop and a surge almost as sharp.
This could indicate a period of consolidation for EOS as it decides its next direction.
Algorand [ALGO]


Source: ALGO/USD on TradingView
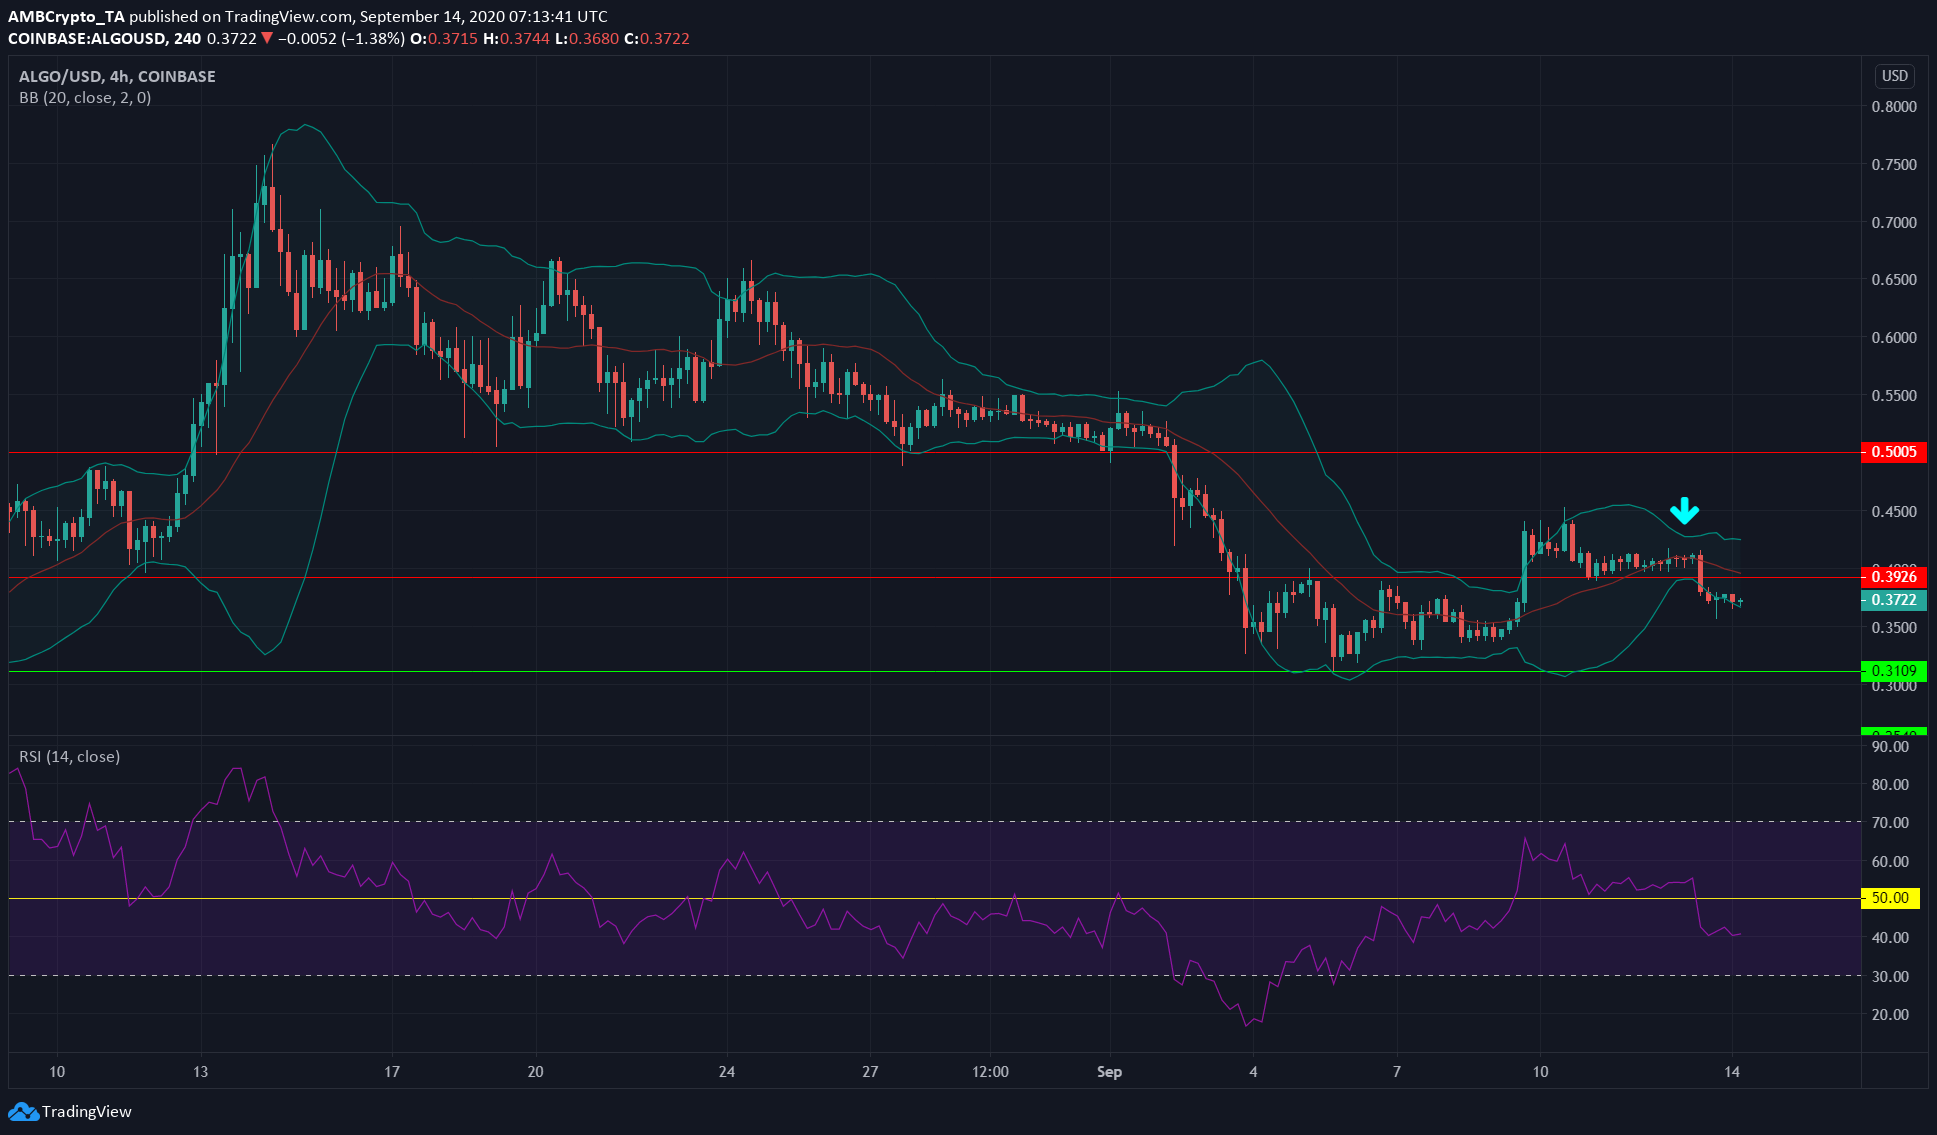
Algorand appeared to begin a period of consolidation, one highlighted by the cyan arrow. The Bollinger Bands had converged on the charts, following which, ALGO dropped beneath a level of support at $0.39.
The RSI, which had been above 50, also dropped and was at 40, at the time of writing.
However, Bollinger Bands had begun to widen at press time, with the price consistently around the lower band over the past few trading sessions. This hinted at the likelihood of ALGO dropping toward its support at $0.31 in the coming days.
The post appeared first on AMBCrypto


