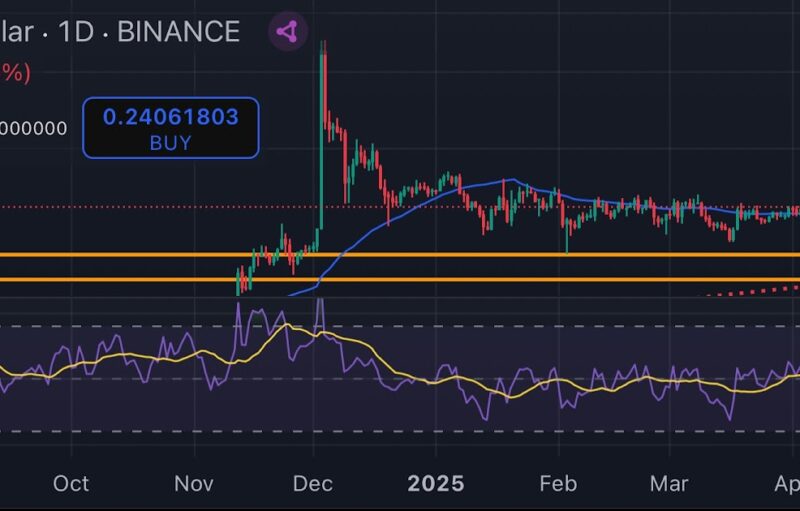
With a $6.9 billion market cap, Stellar has remained close to the top-10 cryptocurrencies and consolidated fairly after its rally during the 1st week of January. XLM re-tested its support a few times but rather than consolidating low, it has continued to bridge the gap nears its yearly high of $0.414.
The long-term analysis remains a little neutral for Stellar but some bullish signs were evident.
Stellar 4-hour chart
After rising to its yearly-high of $0.414, XLM retraced more than 50%, down to $0.208. However, since then, the support has not been tested but the token did test $0.226 twice over the past couple of weeks. Stellar registered a fake breakout as well, from a strong ascending triangle pattern that did not breach resistance at $0.334.
Now, over the past week, things are appearing better for the crypto. Stellar is currently displaying a symmetrical triangle pattern in the charts, but the token remains under its resistance at $0.334. Stellar hasn’t reached this point since dropping under $0.334 on January 7th.
After a prolonged period of consolidation, the chances of re-testing its yearly high of $0.414 are strong.
Market Rationale
The market indicators are currently neutral to an extent but the bullish momentum is slowly building, as displayed by the Awesome Oscillator chart. MACD signaled a bearish outlook at the moment, but the MACD line has maintained close proximity with the bearish indicator.
Relative Strength Index or RSI has consolidated high as well since re-testing the over-sold zone during last week. The collective momentum is adding up for Stellar right now, as we enter February.
Conclusion
Stellar should re-test $0.414 over the course of February if the same momentum is carried forward. With the collective market acting un-correlated with each other, the possibility of a solo-run is also open, as the narrative of the alt season remains large.
The post appeared first on AMBCrypto


