- After witnessing a five-days correction, SNX recovered almost 6% over the last 48-hours trading.
- Sellers may resume pressure if the price fails to increase above the previous resistance.
- The trend is still looking bullish in the short-term despite the five-day selling.
SNX/USD: It Maintains Lower High Lower High Pattern
Key Resistance Levels: $1.83, $1.92, $1.964
Key Support Levels: $1.61, $1.56, $1.44
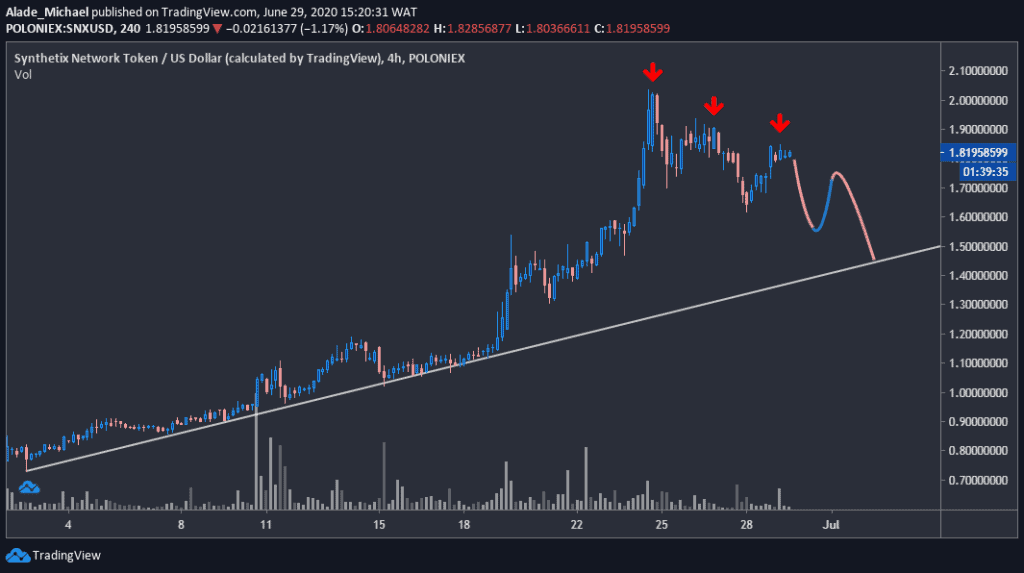
Synthetix Network Token has been under a correction since the price touched $1.964 last week. Following a lower low and lower high pattern, it is now trading around $1.8 level, where sellers are likely to step back into the market.
As can be seen on the 4-hours chart, it is looking for support at the white ascending trend line that was forming since June 3rd. The interesting thing here is that SNX is still looking bullish on a mid-term. A bearish trend may be considered if this line fails to act as support.
Despite the ongoing downward correction, the price is currently up by 5.79%. If the price fails to drop from around the current trading level, more gains can be expected in the next few days.
Synthetix Network Token Price Analysis
If more positive actions surface, buyers are likely to reclaim the previous highs at $1.83, followed by $1.92 and potentially $1.964 – the red-marked arrows in the above chart. A successful push above these levels should initiate a fresh bullish cycle for Synthetix Network Token.
However, it may create new weekly support at $1.44 if the sellers resume pressure in the market. But they would need to clear the current support of $1.61. Below this support lies $1.56 before finding a nice rebound on the white trend line.
SNX/BTC: Price Is Under Consolidation
Key Resistance Levels: 20831 SAT, 21750 SAT
Key Support Levels: 18097 SAT, 16462 SAT
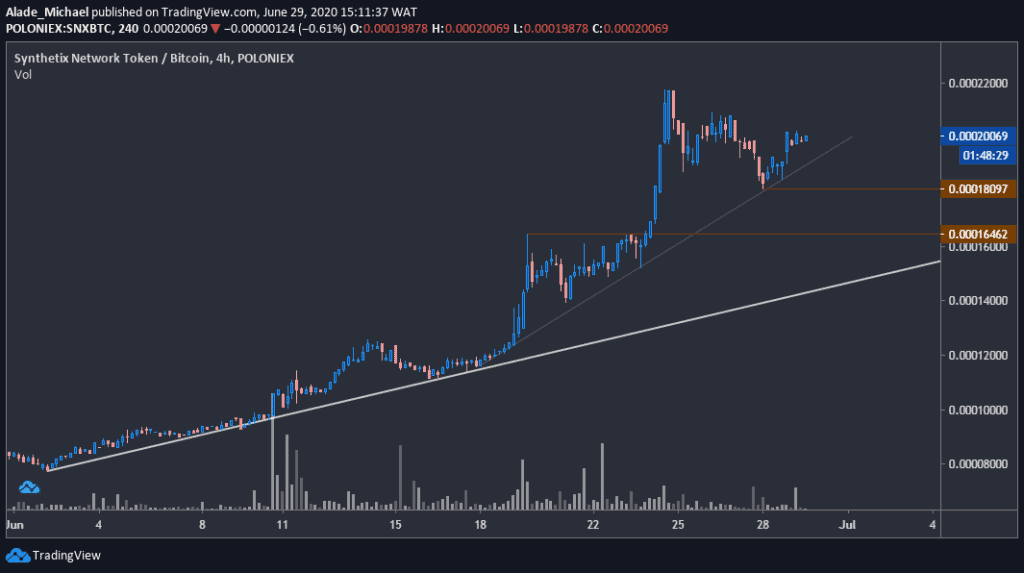
Against Bitcoin, Synthetix Network Token is technically looking bullish on the 4-hours chart, but the last five days have been subjected the price to a small correction due to weakness in buying volume. The latest 5.62% recovery has brought the price back to where it’s currently consolidating around 20000SAT level.
For the past two days, the price has been supported by 18097 SAT level, along with the grey trend line. A nice increase can be expected if this level keeps holding for long.
Synthetix Network Token Price Analysis
While it continues to consolidate, the next line of resistance for the bulls lies at 20831SAT and 21750 SAT. A break above these levels would confirm a short-term bullish continuation for SNX.
For the bears, the holding support of 18097 SAT would be revisited if the price drops beneath the grey trend line. The next support below can be found at 16462 SAT.
Click here to start trading on BitMEX and receive 10% discount on fees for 6 months.
Disclaimer: Information found on CryptoPotato is those of writers quoted. It does not represent the opinions of CryptoPotato on whether to buy, sell, or hold any investments. You are advised to conduct your own research before making any investment decisions. Use provided information at your own risk. See Disclaimer for more information.
The post appeared first on CryptoPotato


