(Any views expressed in the below are the personal views of the author and should not form the basis for making investment decisions, nor be construed as a recommendation or advice to engage in investment transactions.)
I have very few original ideas when it comes to global macroeconomic conditions. I rely on the writings of my macro forefathers, and translate their ideas into what I hope is a more digestible and entertaining format for my audience. One of my foredaddies is Felix Zulauf. His newsletters are not published on any set schedule – when the market conditions warrant a piece, he writes one. Given that the subscription to his writings is not cheap, I appreciate that he opts for quality over quantity.
Daddy Felix routinely espouses his belief that the quantity of money (USD) is more important than the price of money (USD interest rates). While I understand on a superficial level why that makes sense, it never clicked for me until his most recent newsletter.
Recently, the Fed has sterilized its tapering in the last few weeks, which in addition to the Treasury’s large liquidity injection into the credit system has driven the rally in risk assets. We do not know what considerations are driving the Fed’s recent action, but if continued it would soften our expectation for a hard monetary tightening in the US to some degree. At the present time, we are not changing our view, however, we will continue to closely monitor the situation.
The Fed is supposed to be reducing the size of its balance sheet to tighten USD liquidity conditions, but Daddy Felix said the tightening is being offset by other measures. I didn’t really understand what he meant, so I sent Daddy an email. Daddy didn’t disappoint, and he schooled me a bit. It’s always great to learn something new from one of the greats and achieve a higher level of understanding.
Subsequent to my email conversation with Daddy, a friend of mine shot me a message challenging part of my macro thesis with regards to the Fed pivot. He created his own liquidity index to monitor this phenomenon, and it in part inspired me to do the same.
USD liquidity conditions are comprised of three parts:
- The size of the Fed’s balance sheet. The Fed credits member banks’ Fed accounts with money, and in return, banks sell the Fed US Treasuries and/or US Mortgage-Backed Securities. This is how the Fed “prints” money to juice the financial system.
- The size of Reverse Repo (RRP) balances held at the NY Fed. The NY Fed allows eligible counterparties to deposit USD and earn a rate of return. The deposited funds become dead money once they enter the Fed’s account. It is dead money because the Fed does not use the deposited funds to make commercial loans. If it did, it would increase the supply of credit money in the financial system. In effect, the money multiplier for RRP balances at the NY Fed is 0x, vs. a non-zero multiple when deposited with any other financial intermediary. (Pre-pandemic, the reserve ratio requirement hovered between 3% to 10% – resulting in a 33x to 10x money multiplier for US commercial banks – but the Fed has since slashed it to 0%, meaning that commercial banks can lend out 100% of the deposits they receive with no obligations to hold any of those deposits as a safety net). Money market funds (MMF) are funds in which retail and institutions place cash to earn short-term yield. In my brokerage account, any spare cash I have is deposited in an MMF, and I can get my cash back within one business day. MMFs can deposit funds in the RRP, and a variety of other low-risk short-term credit instruments (e.g. US Treasury bonds, AAA-rated US corporate commercial paper). Leaving money with the Fed is the least risky option, and pays about the same as the other two options, which do carry some risk. Therefore, MMFs prefer to park money with the Fed, if they can, rather than in the leveraged financial economy.
- The US Treasury General Account (TGA) balances with the NY Fed. This is the US Treasury’s checking account. When it decreases, it means the US Treasury is injecting money into the economy directly and creating activity. When it increases, it means the US Treasury is saving money and not stimulating economic activity. The TGA also increases when the Treasury sells bonds. This action removes liquidity from the market as buyers must pay for their bonds with dollars.
To sum it up in very basic terms, USD liquidity increases and decreases under the following circumstances:
USD Liquidity – Number Go Up:
Fed Balance Sheet – Increases
RRP Balances – Decreases
TGA – Decreases
USD Liquidity – Number Go Down:
Fed Balance Sheet – Decreases
RRP Balances – Increases
TGA – Increases
However, all three of these underlying factors are not always pointing in the same direction – e.g., sometimes the Fed balance sheet is growing while the TGA is, too. So, whether USD liquidity is increasing or decreasing is dependent on the interplay of these three factors, their direction, and the extent or rate at which they are occurring.
While the Fed started Quantitative Tightening (QT) in June of this year – meaning they decided to allow their balance sheet to shrink with the goal of fending off inflation – the decrease in the size of their balance sheet has recently been outweighed by decreases in RRP balances and the TGA. This has generally caused USD liquidity to increase, rather than decrease.
The maximum size of the RRP facility, the return rate offered, and the entities allowed to use it are all at the complete discretion of the Fed. Therefore, the Fed can influence the impact this faucet of liquidity has on the overall market. For example, the Fed could shutter the facility completely, forcing MMFs and others to put their cash elsewhere and unleashing $2 trillion of base money into the system in the process. This base money, depending on who it’s given to, can be further leveraged to aggressively juice financial economic activity. Recently, the RRP has decreased, and I don’t have (nor have I read) a cogent theory as to why balances declined – but for the purposes of this piece, all we need to understand is that it’s been going down.
The election is only a few months away, and it is generally accepted that many people vote with their wallets. To help buoy perception of the US economy amongst wallet-voters from now until November, Yellen and the US Treasury could choose to create looser monetary conditions directly – funnelling a large part of the remaining $500 billion in the TGA into the economy and, by extension, pumping stonks. Over the summer, the TGA balance shrunk. Similar to the recent decrease in the RRP, I don’t have a credible theory as to why – but again, all we need to know is that it got smaller.
So the RRP balance has recently decreased, as has the TGA – begging the question: are the NY Fed and the Treasury actively using the RRP and TGA levers to work against the Fed’s current stated policy of fighting inflation by reducing the quantity of money? And if so, do they intend to continue doing so? I don’t have an answer to these questions, but there is always a strong political will among the ruling party to generate favourable short-term economic conditions before an election so that party members can keep their jobs. They are human, after all.
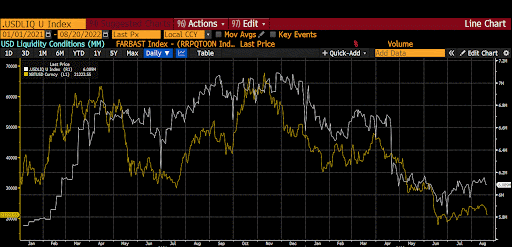
When this all finally clicked in my head, I pulled up my handy Bloomie and created a custom chart that depicts what I’ve dubbed the USD Liquidity Condition Index.
USD Liquidity Conditions Index = [The Fed’s Balance Sheet] – [NY Fed Total Amount of Accepted Reverse Repo Bids] – [US Treasury General Account Balance Held at NY Fed]
Bitcoin vs. USD Liquidity Conditions Index
In this current phase of the crypto currency capital markets, Bitcoin represents a high-powered coincident (and sometimes leading indicator) of global USD liquidity conditions.

To establish the veracity of this relationship, let’s look at local liquidity tops and bottoms from 2021 until the present.
|
Date |
4/15/21 |
6/30/21 |
|
|
USD Liquidity (tn) |
$6.83 |
$6.24 |
-8.72% |
|
4/15/22 |
7/20/21 |
||
|
Bitcoin |
$63,410 |
$30,776 |
-51.47% |
|
Bitcoin Beta Factor |
490% |
||
|
Date |
11/26/21 |
6/30/22 |
|
|
USD Liquidity (tn) |
$7.09 |
$5.82 |
-17.86% |
|
11/9/21 |
6/18/22 |
||
|
Bitcoin |
$67,734 |
$17,785 |
-73.74% |
|
Bitcoin Beta Factor |
313% |
||
|
Date |
6/30/22 |
8/18/22 |
|
|
USD Liquidity (tn) |
$5.82 |
$6.09 |
4.60% |
|
6/18/22 |
8/18/22 |
||
|
Bitcoin |
$17,785 |
$23,416 |
31.66% |
|
Bitcoin Beta Factor |
588% |
Each date corresponds to a local top or local bottom – and the timing is uncanny. Bitcoin consistently overshoots on the upside, and undershoots on the downside. It’s a bit unfortunate that currently, Bitcoin is just a high-powered measure of USD liquidity, but on a fundamental level, it’s not surprising.
Bitcoin is digital money and represents a different system and ideology regarding how society can best organise its monetary affairs. The USD is the global reserve currency, and it comes installed with the American-led western financial system. If the USD system generates excesses, Bitcoin is there to absorb them. Bitcoin is a real-time smoke alarm tied to the profligacy of the USD-based financial system.
Price vs. Quantity
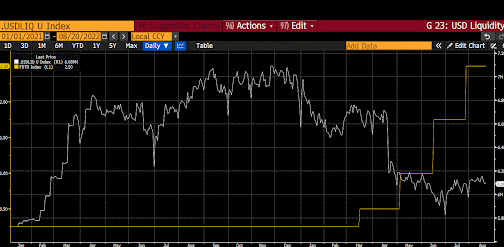
Which is more important to risk assets – the price of USD (the Fed funds rate) or the quantity of USD (USD liquidity conditions)?
Fed Funds Upper Bound (yellow) vs. USD Liquidity Conditions (white)

The Fed started “aggressively” raising its policy rate in March of this year. However, bouncing off of a recent local bottom, USD liquidity conditions have begun to improve. Risk assets like Bitcoin and stonks have responded positively to rising USD liquidity, even though the price of money has increased.
So currently, it would appear that the performance of financial assets is more contingent on the quantity of money than the price.
(On a related note, I have no clue how the quantity and price of money running in opposite directions impacts the decision-making of real businesses – and I posit that the mandarins running global financial institutions have no idea, either.)
Bitcoin Control Factor
Most cryptos cannot outperform the market in USD terms on an absolute basis when Bitcoin is getting clubbed. However, my confidence in the positive near-term price performance of Ether is due entirely to the expected impact of the impending merge. I explained this in detail in my last two essays, “ETH-flexive” and “Max Bidding”.
In the latter essay, I argued the case for why we might in the near-term see the Fed pivot away from fighting inflation and turn its focus to easing financial conditions (TL;DR, to arrest the ongoing decline of the financialised US economy). However, if we look back at the USD Liquidity Conditions Index chart, the Liquidity Conditions Index recently declined from a local high (meaning liquidity conditions tightened), and cryptos were decapitated as a result. I can form all the fancy theories I want about why a Fed pivot is upon us, but if the USD Liquidity Conditions Index continues heading lower, I will simply be wrong. But, now that I have a more complete fundamental understanding of how the different aspects of this index contribute to more or less USD liquidity, I can form a more nuanced view as to how the Fed could start riding two horses with one ass.
Let’s approach the situation as a politician who cares more about accounting and public perception rather than economic reality. I need the Fed to appear to be fighting the inflation scourge that is rendering my constituents paupers – but I also need the stock market to pump, so my rich donors are happy. What to do?
If the quantity of money has a greater effect than its price on financial markets, then the Fed can raise interest rates all it wants without hurting the market – so long as the USD Liquidity Conditions Index also rises. The act of raising policy rates would make it seem as though the Fed is fighting inflation, and the Fed can even allow its balance sheet to fall to help keep up appearances. But in its back pocket, it still has the ability to influence RRP balances, and it can also call upon the Treasury to spend more money to generate economic activity – thereby causing a net increase in money and bolstering stock performance. Obviously, these two potential levers have finite capacities – neither the RRP balances nor the TGA can go below zero – but they can still be used to effectively offset QT in the short-term.
All of that said, I am still concerned about the macro financial conditions leading into and directly after the merge, which, if it’s on schedule(ish), will take place two months before the November US midterm elections. I continue to believe there is a strong possibility that even if the Fed doesn’t signal a formal pivot, the NY Fed and the Treasury may engineer a release of USD liquidity heading into the election (via RRP balances and the TGA) that will act in the background as a booster for risk assets – but, to quote Billions, I have to admit I am not “not uncertain”.
Unless the Fed or Treasury come out and definitively tell us there will be changes to the RRP facility or the pace at which the TGA will be depleted, we are left to just monitor the weekly changes in the three Liquidity Index variables and make imperfect assumptions about their near-term trajectories.
(Readers don’t need a Bloomberg or any other paid charting software program to construct this index. All of these components are released publicly by the government once or multiple times each week. If you want to know why a dramatic change in crypto price action occurs outside of some major technology developments, this is a key index to watch.)
Some will argue that I’m moving the goal posts to justify my market positioning, and that’s completely fair. However, as I’ve said before, I think the merge will drive positive price movement for ETH regardless of USD liquidity conditions. I still believe that the positive price impact of a severe reduction in ETH emissions and the positive reflexivity between the price / network activity / network usage would overcome any situation in which USD Liquidity Conditions are tightening – it’s just that the price movement might be weaker than I forecasted or hoped for.
Related
The post appeared first on Blog BitMex


