At the time of writing, Tezos was ranked 13th on the charts with a market cap of $2.32 billion. With XTZ priced at $3.14, the crypto was registering a decline of 1.05% over the last 24 hours. However, when XTZ’s lower time frame charts are observed, it would seem that more of these declines may be on their way. On the contrary, when the higher time frame charts for 1-day are observed, it can be noted that Tezos had reached levels last seen in February 2020.
What this means is that the price levels will face resistance and hence, the same might be bearish for the XTZ in the near-term.
Tezos 1-hour chart


Source: XTZUSD on TradingView
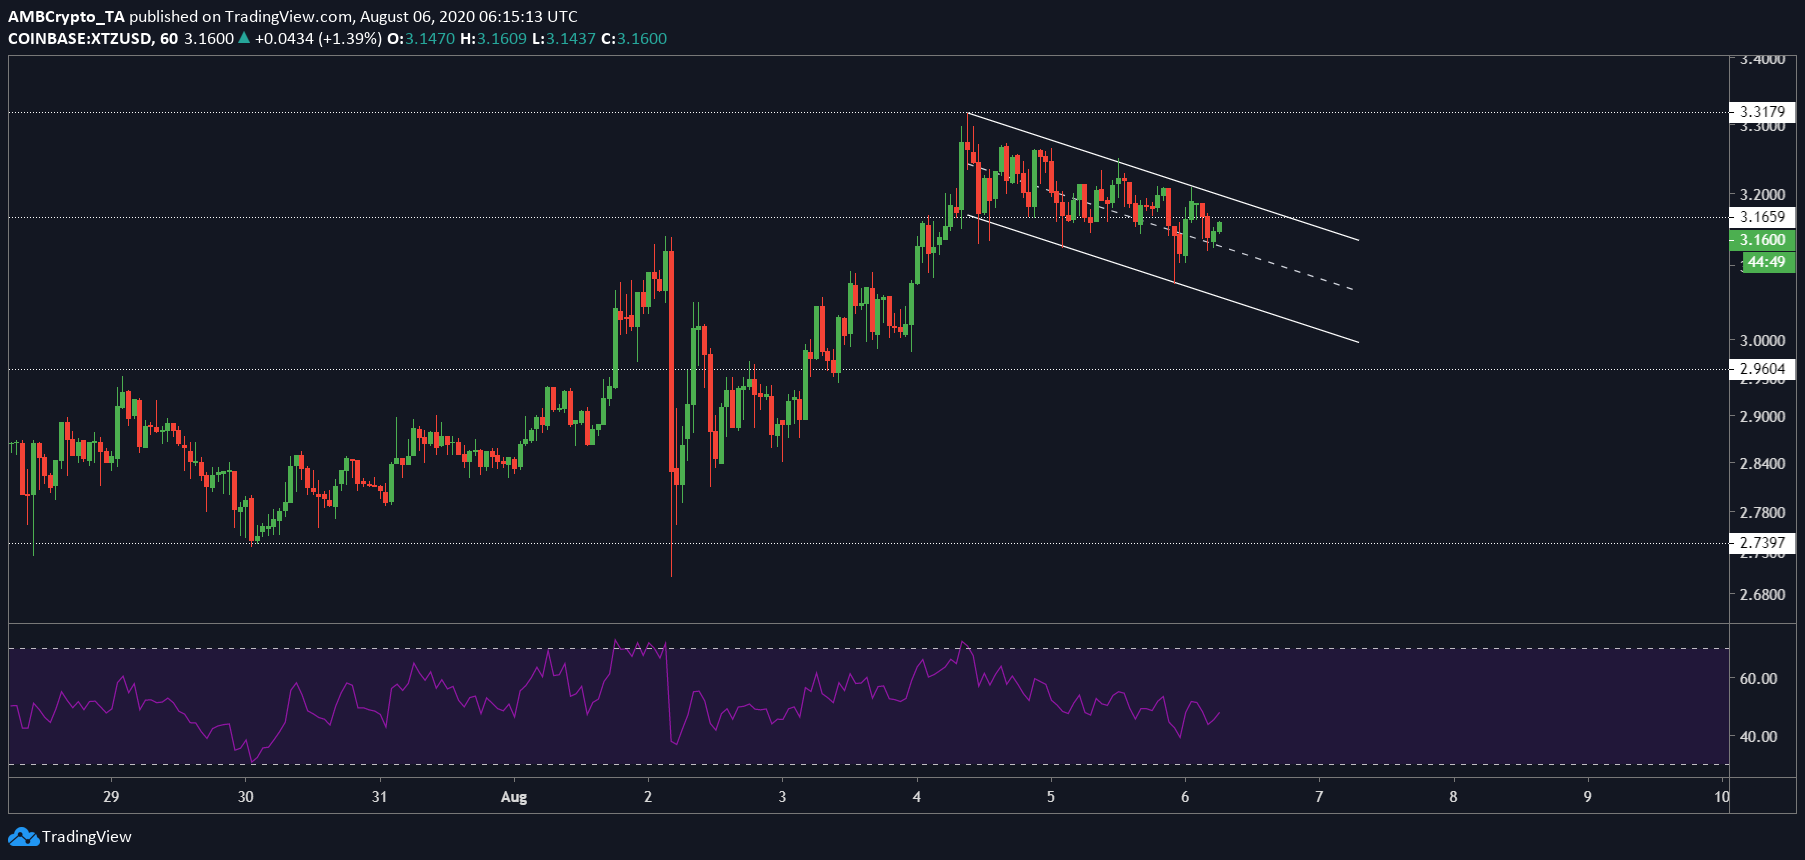
From the chart attached above, the formation of a downward sloping parallel channel which has a bullish breakout can be clearly observed. However, looking at the pattern at hand, it would seem that there are a few more bounces that might push the price lower.
The RSI indicator was present at the 50-level aka the neutral zone, one wherein buyer and seller activities were balanced out. Further, the resistance was at $3.165, a level which will prevent the price from heading higher, or at least will resist the move upward, even if it is momentary.
The breakout, which is bullish, will push the price to the target of $3.1659 and if the bulls persist, even to $3.3179.
Tezos 1 day chart


Source: XTZ/USD on TradingView
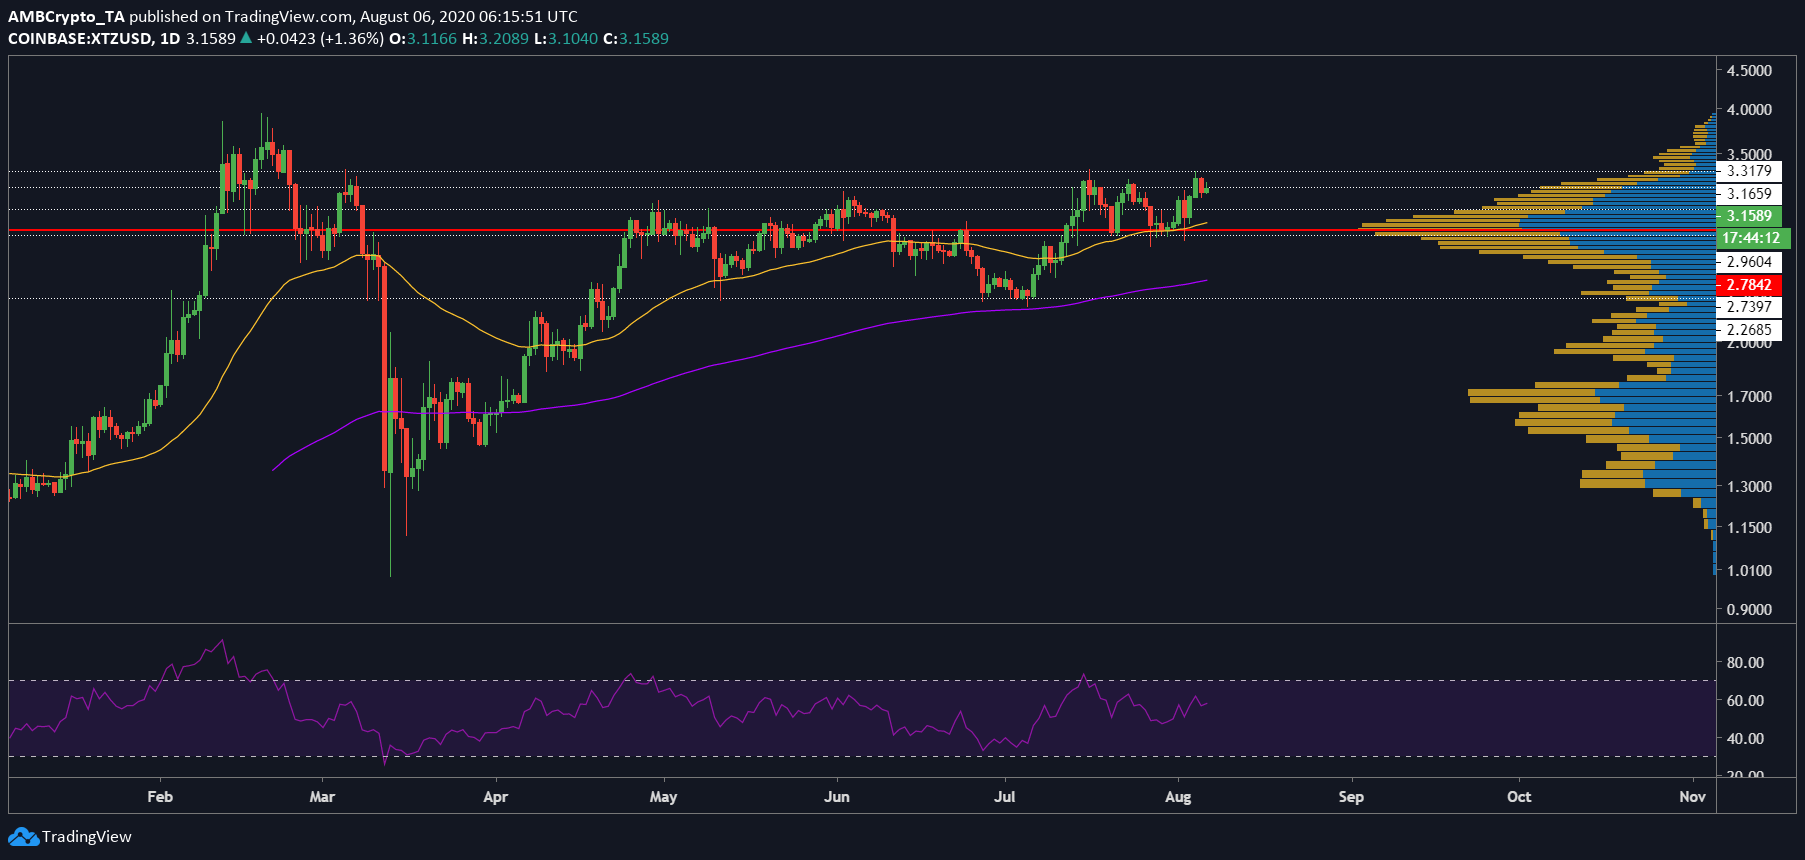
Unlike the previous two peaks, both of which were equal, the press time peak was higher. Hence, it was bullish in terms of price action. The VPVR indicator showed the PoC line at $3.159, which was the price level for most trading activity in the aforementioned frame. The price had failed to breach the resistance at $3.317, a development that contributed to a downtrend that was pushing the price lower to the support at $3.1659 and even $2.960.
The RSI indicator also showed the formation of lower highs, with the same at the 60-level, at press time. If the downtrend were to continue, then the price will head lower to the 50-DMA [yellow], a level that will support the price from heading lower. Although highly unlikely, the 200-DMA [purple] will also act as support, should the price head that low.
The post appeared first on AMBCrypto


