Disclaimer: The following article attempts to analyze the emerging patterns in Tezos’ long-term market and its impact on the price
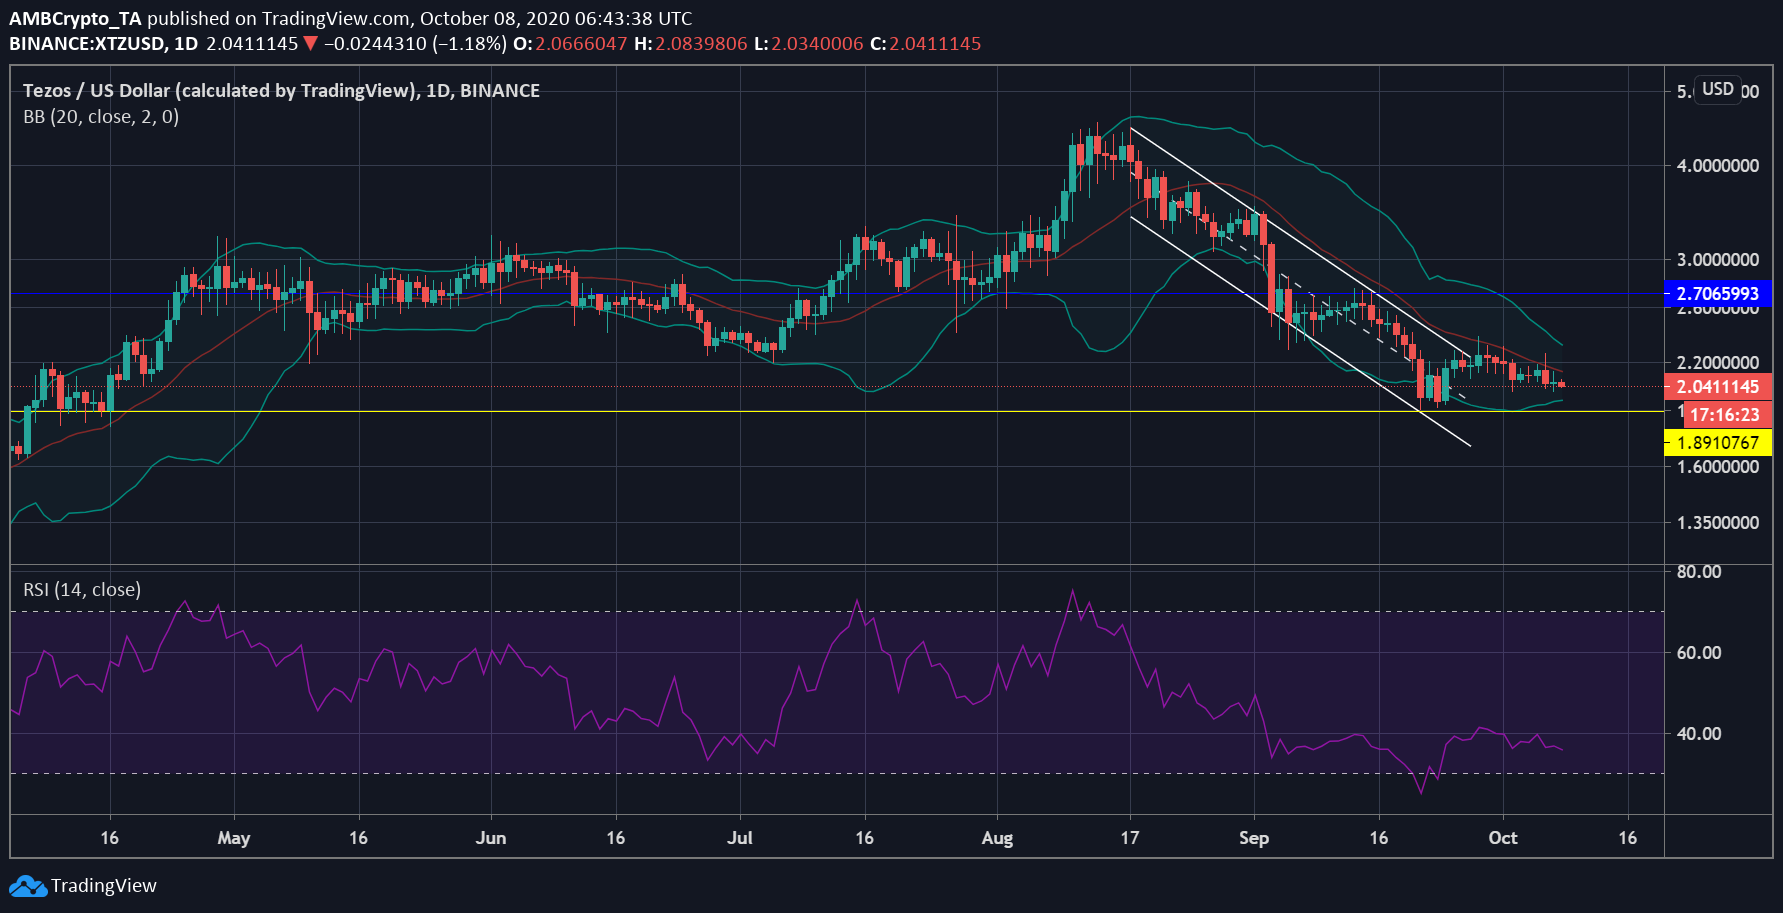
The recent fall in Bitcoin’s price did not have much of an impact on the Tezos market as the cryptocurrency was already on a trajectory going south. The crypto-asset’s value has been crumbling since mid-August, with the same failing to note a trend reversal since. XTZ’s downward-sloping price has been forming lower lows every day, with the same contained within a descending channel on the charts.
With a value of $2.03 at press time, XTZ was recording no signs of a trend reversal.


Source: XTZ/USD on TradingView
The aforementioned descending channel plotted on the daily chart underlined the sell-offs that had taken place since mid-August in the XTZ market. While the price did note some sideways movement for a few days, the trend has largely remained bearish.
XTZ’s falling price tested the support at $1.89 and bounced back up, but it could not go higher and was consolidating between $1.89 and $2.38. The Bollinger Bands were highlighting that the volatility in the market had reduced as the bands were converging on the charts. Further, the signal line remained above the candlesticks, like it has been since the coin started trending lower on the charts.
As XTZ tested its support level, it briefly entered the oversold zone. This was visible in the Relative Strength Index as the Signal Line slipped under 30. Although the Signal Line had recovered and was at 35, at press time, it remained close to the oversold zone.


Source: XTZ/USD on TradingView
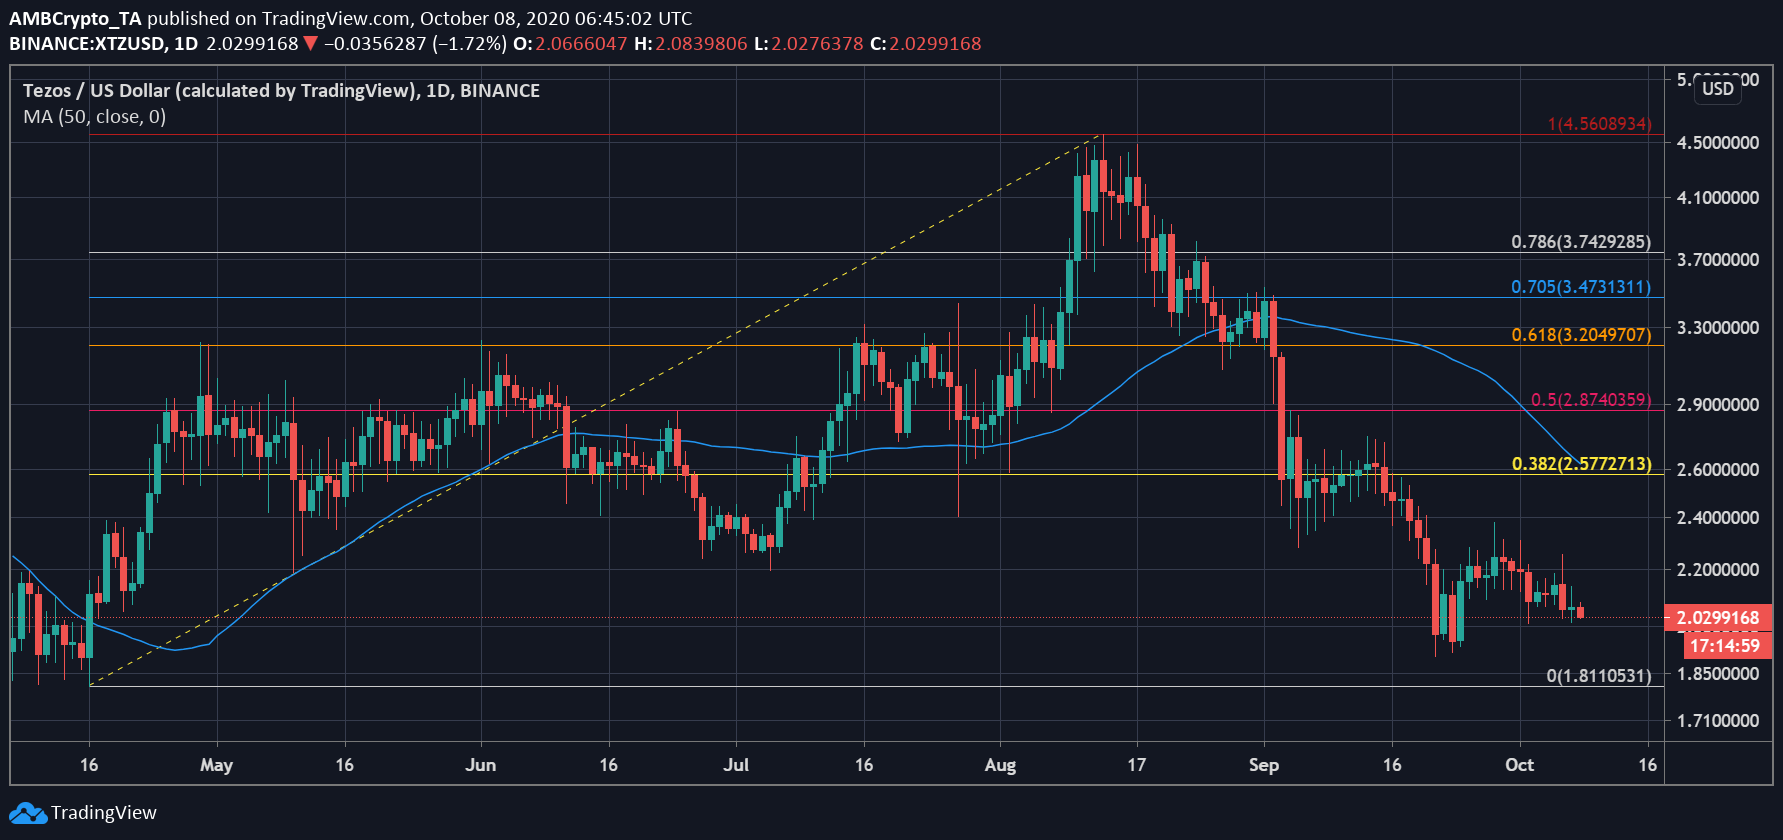
The price of XTZ had been moving wildly over the past couple of months, with the same noting its annual high of $4.56, following which it moved lower. The Fib retracement tool identified the support for the coin at $1.81, in the given period, whereas, the next resistance level for XTZ was higher at $2.57, due to the collapsing price.
The price of XTZ has not been stuck between these levels in the past. Ergo, we may witness a change in the price level in the long-term.
The post appeared first on AMBCrypto


