Tezos, the cryptocurrency ranked 14th on the charts with a market cap of $2.38 billion, has been hurt following the token’s recent depreciation. The fall in question was worth around 26%, with respect to the price’s press time position at $3.29.
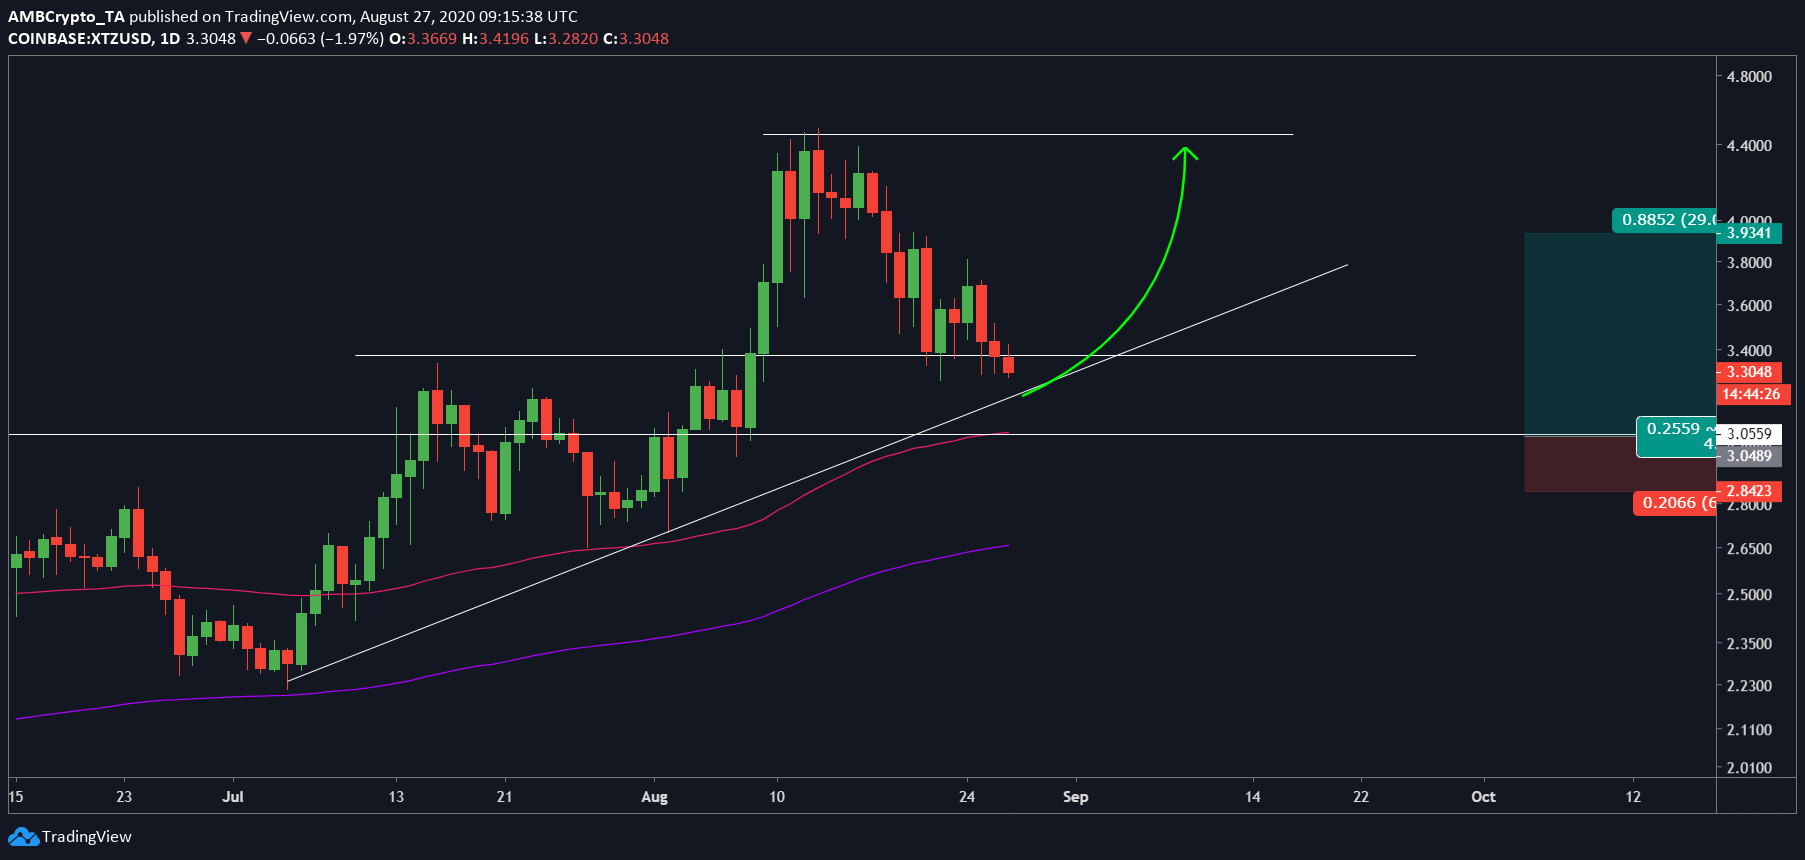
There are two trades that can be taken here; the first is the short position that will push the price down by 7.22% and towards its support at $3.05. The second trade would be to wait for the price to test this support and then enter a long position from here.
The first trade has lower profits with little risk. However, the second trade has huge upsides but is even riskier.
Tezos 1-day chart


Source: XTZUSD on TradingView
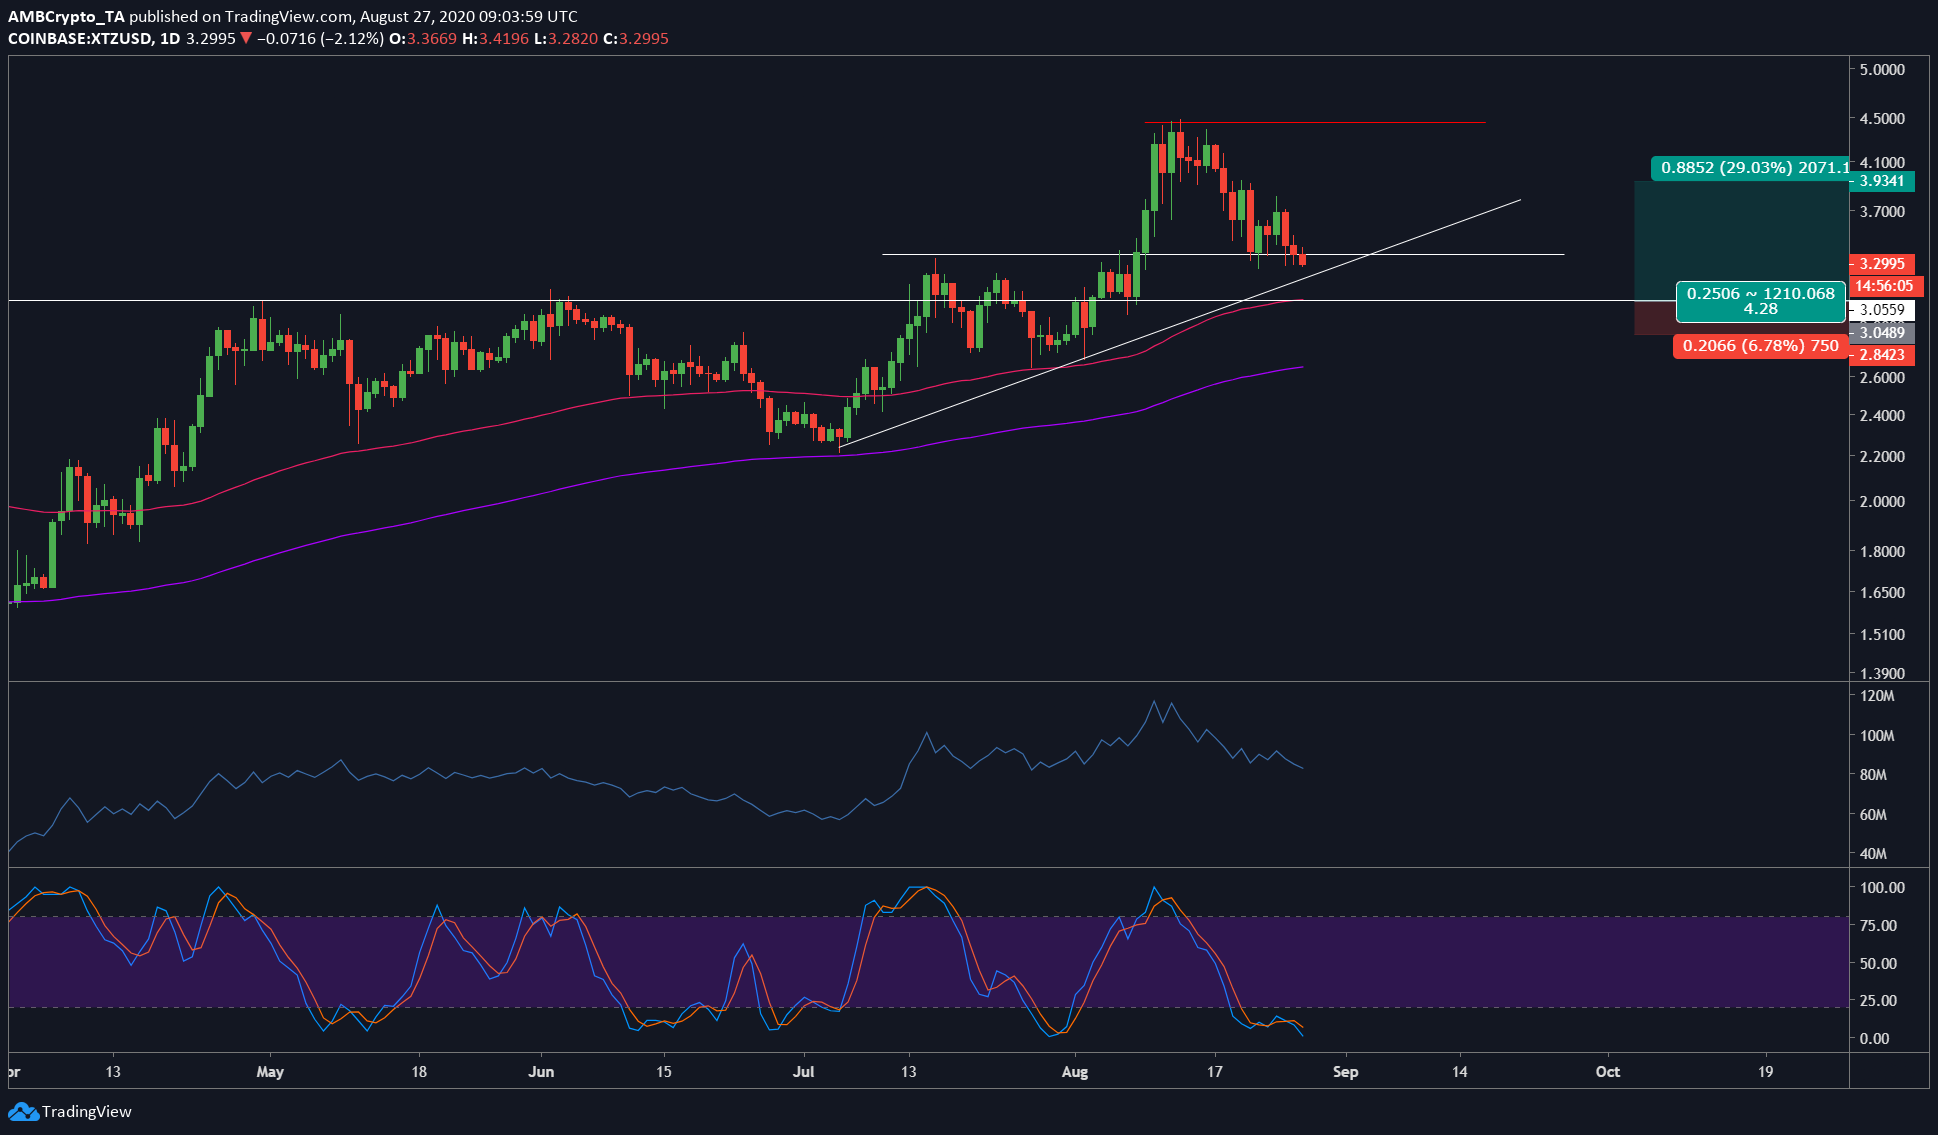
The one-day chart showed Tezos breaking down its range, as mentioned in a previous article. Now, the immediate support was at $3.09, but also present was the inclining support starting from the bounce at 200 DMA [purple] and extending all the way up to 02 August. If Tezos continues to fall on the charts, then the price will hit a confluence of support.
This, with the indicators’ help, is the decision leading to the long yet risky position mentioned above.
In addition to the same, the 100 DMA [pinnk] will also be the last line of defense should the above support levels fail. The 200 DMA was also present in the worst-case scenario and will support the price from falling any further than $2.66.
Tezos 1-Day chart


Source: XTZUSD TradingView
The entry position would be a bounce from the support at $3.055 with stop-loss at $2.84. The bounce from here has the potential to push the price back to its recent high of $4.45. The trade would have a risk-to-reward ratio of 4.28.
Supporting this was the Stochastic RSI indicator since it was deep in the oversold territory and was vying for a bullish crossover. This crossover will be achieved if the price bounces of the aforementioned support level.
The post appeared first on AMBCrypto


