Disclaimer: The findings of the following article are the sole opinion of the writer and should not be taken as investment advice
Between 13 August and 24 September, Tezos registered a 58 percent sell-off, with the cryptocurrency dropping all the way down to $1.91. While the decline was certainly not pleasurable for many of XTZ’s investors, the pullback has been rather disappointing as well. Struggling to consolidate above its major resistance level at $2.30, XTZ, at the time of writing, resided around the $2.22-level.
However, an analysis would suggest that a minor correction might take place over the next few days. XTZ had a market cap of $1.71 billion, at press time.
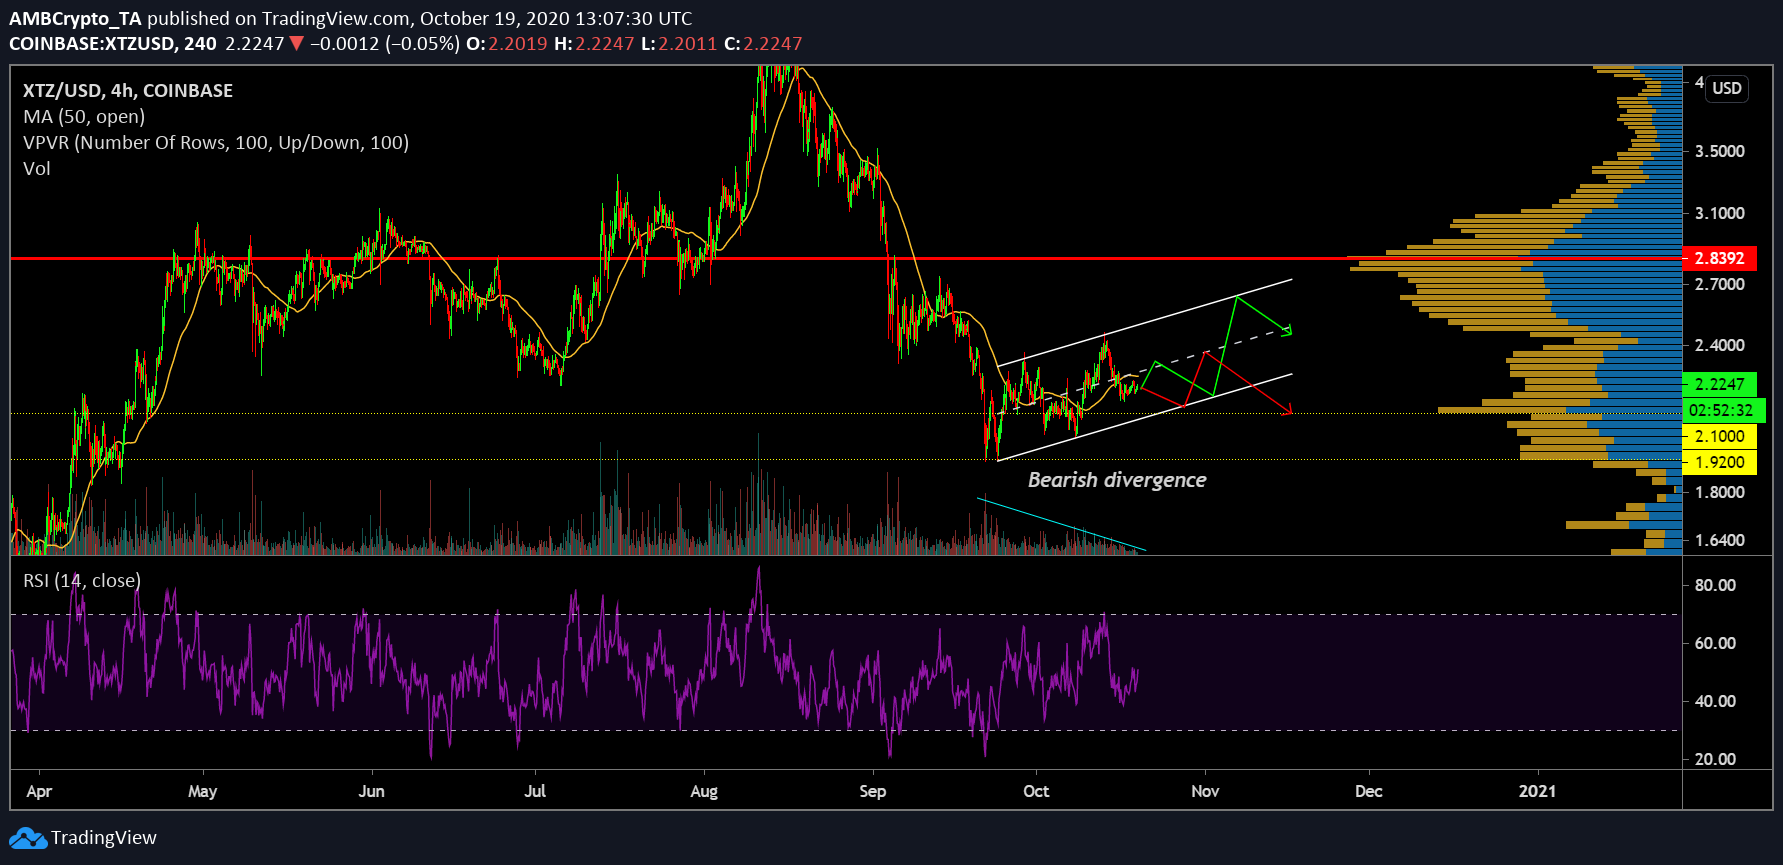
Tezos 4-hour chart
The 4-hour chart for Tezos pictured the formation of an ascending channel, one that was carrying bearish implications, at the time of writing. While a green path represented a strong bullish move and a correction thereafter, the bearish divergence between the price and the volume begged to differ. Keeping the bearish picture in mind, the red path hinted at a more reasonable movement.
The fact that the price remained under the 50-Moving Average is a point of concern, with the MA thrusting high sell-off pressure from the top. Similarly, the Relative Strength Index or RSI continued to highlight the dominance of the market’s sellers, keeping the market under 50.
Tezos 1-hour chart


Source: XTZ/USD on TradingView
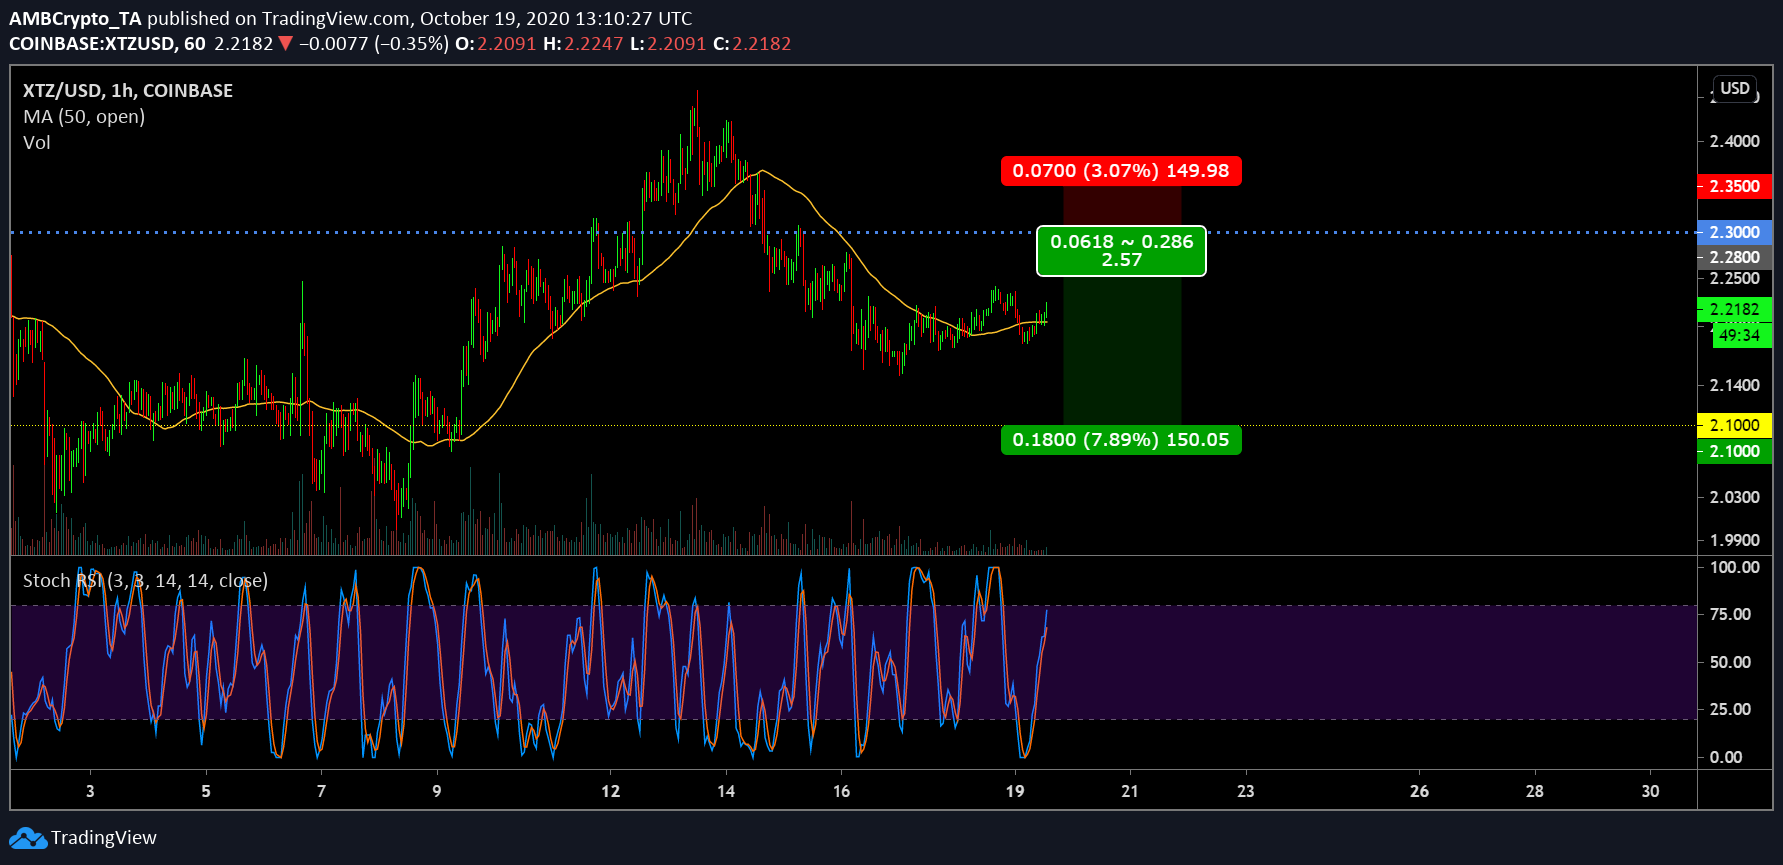
Without missing much of a trend, another round of correction is possibly going to take place for XTZ, with $2.10 being the target. A shorting position can be opened over the next few days, however, the entry point might vary according to volatility. While the price might rise to touch $2.30 (immediate resistance), a drop might take place from $2.28 as well. Keeping the stop-loss at $2.35 would avoid massive losses if the price picks up on a market surge.
The take-profit can be placed at the support level of $2.10, completing a Risk/Reward Ratio of 2.57x.
Finally, the Stochastic RSI pointed to a bullish trend at the time, one that verified its minor movement upwards. However, the bullish trend was close to crossing the overbought zone from which the bears might take control over the next few days.
The post appeared first on AMBCrypto


