A rare bullish signal took place this week. The Golden Cross, as it’s commonly referred to, is a phenomenon that happened despite the price of Bitcoin dropping from $10,500 down to its current level at around $9,800. Historically, this has caused BTC to surge in value in the mid-term.
Bitcoin’s Most Recent Golden Cross
Bitcoin went on a downfall the past couple of days. Having reached $10,500, the price declined violently, losing as much as $1,000 in the following days. BTC found support in that area and recovered slightly as it currently trades at around $9,750.
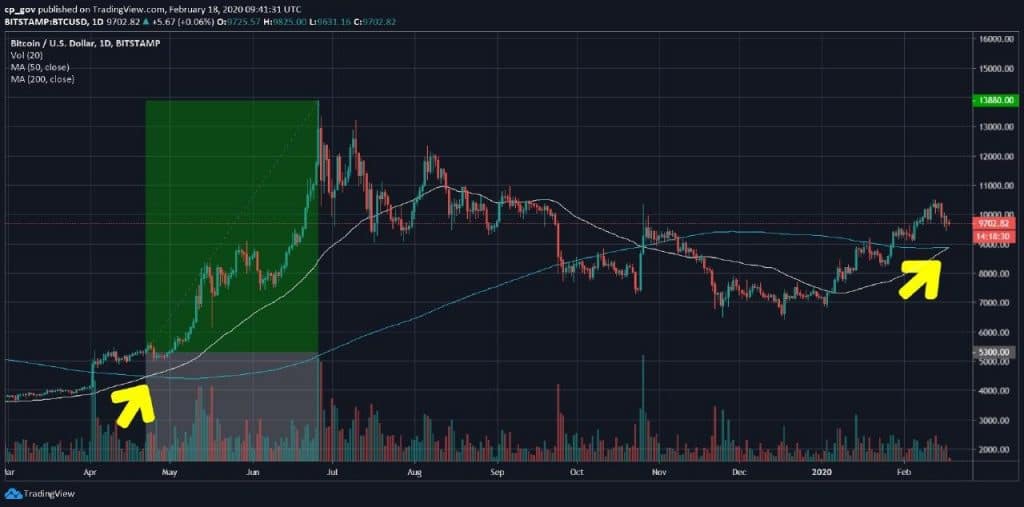
However, despite the steep decline, a rare bullish signal flashed once again on the charts. Bitcoin’s 50-day moving average just crossed over its 200-day moving average.
This is a rare phenomenon that is commonly referred to as the “golden cross.” It’s a historically bullish pattern, and it takes into account two of the most commonly used moving averages.
The last time this happened was back on the 22nd of April in 2019.

Bitcoin Charting Golden Crosses in 2019 and 2020. Source: TradingView
As seen on the chart above, after the Golden Cross took place in April last year, the price surged to its yearly high at around $14,000 in June – approximately about 60 days after the cross happened. This marked an increase of nearly 165% in the given period.
Bitcoin is currently trading at around $9,750. If history repeats itself and the pattern does drive the price higher, an increase of 165% would put BTC at approximately $26,000 by the end of April 2020. Interestingly enough, this is immediately before Bitcoin’s halving takes place as it’s estimated to happen in May.
In-Line With Current Bitcoin Price Predictions
It’s worth noting that a few experts have already shared their Bitcoin price predictions for the short term.
First was Fundstrat’s Tom Lee, who said that Bitcoin could reach $27,000 by July. His main argument was that the price was trading above the 200-day moving average, which historically suggests increases of about 190% in the next six months. What is more, he also said that this happened in 80% of the situations.
Mike Novogratz also gave his prediction. According to him, Bitcoin is the “best brand of the past eleven years” and that it will test $20,000 in 2020 once again. Moreover, he said that this could also happen by the time Bitcoin’s halving takes place in May.
Be Careful With Bitcoin Price Fakeouts
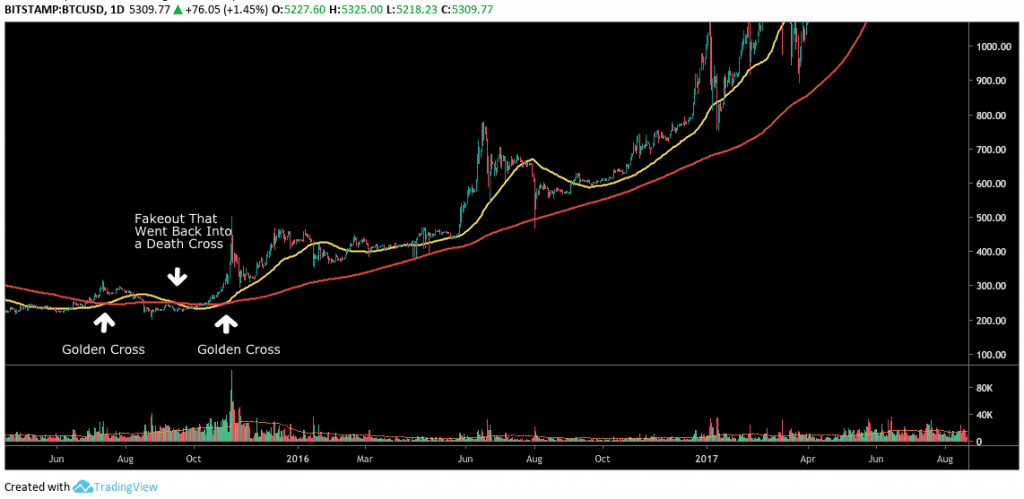
History should never be used as a flat-out indicator for future price movements. Even though the Golden Cross has historically produced increases in the mid and long term, it’s also essential to keep an eye out for fakeouts.

Golden Cross Patterns in 2015. Source: TradingView
As Cryptopotato reported, back in 2015, Bitcoin charted two Golden Cross patterns. The first one, however, appeared to be a fakeout, and the 50MA temporarily crossed back below the 200MA. Even though it continued back up, taking up short-term long positions might be riskier, despite the bullish crossover.
Click here to start trading on BitMEX and receive 10% discount on fees for 6 months.
The post appeared first on CryptoPotato


