 To Buy or To Sell?
An inordinate amount of time is spent debating – with maximum consternation – whether to buy or sell. The charts that guide us on our journey depict the emotional roller coaster a group of humans travel in their quest for profits.
Electronic trading dominates most markets, and is dictated largely by cold and calculating algorithms– but it’s important to remember that those algorithms are built by red blooded, irrational humans. Humanity ebbs and flows on somewhat predictable cycles, so it follows that the markets we inhabit are cyclical as well. As self-evident as this is, the madness of the crowd forgets that we move like a SIN wave and extrapolate using straight lines on the up and downside.
Our inability to recognise the cyclical nature of all markets leads us to ignore inconvenient truths about the assets we wish into the stratosphere. The inconvenient truth that haunts crypto at this current juncture is that crypto moves in lockstep with the debt-based, un-free risk asset markets like global developed market equities. This is despite all the hard work of Lord Satoshi’s loyal supplicants, who are fighting to create a counter-narrative grounded in technological truth.
The life blood of the debt-based un-free capital markets we abhor is the central bank printed fiat wampum. As I have beaten into readers’ heads since early this year, the bankers who preside over the fiat money Tower of Babel finally woke up and decided to press pause on the money printer. From Brrr to Shhh. And in this silence, the ugliness of TradFi asset markets has become apparent.
In “Energy Cancelled”, I argued that the Petro / Eurodollar global financial architecture ceased the day the West decided to confiscate the fiat reserve assets of the Russian Central Bank. This action ushered in an era in which it’s entirely reasonable for any sovereign that isn’t the US or an EU country (a.k.a., the Global South) to “save” in gold and ultimately Bitcoin. On a three- to five-year horizon, this eventuality will lead to Bitcoin reaching $1 million and gold reaching $10,000.
While that bullish prognosis is exciting, we live in the present – not the future. Many of us must make decisions right now on whether to sell fiat and buy crypto. I continue to argue for patience. So lace up your On CloudFlyers and let’s stride down a street filled with informative charts that clearly depict the calamitous outcome we stand on the precipice of.
Big Bad Tech
Justified or not, the market lumps crypto and big tech in the same cesspool. The Nasdaq 100 Index (NDX) represents big tech.
Bitcoin vs. NDX 10-day correlation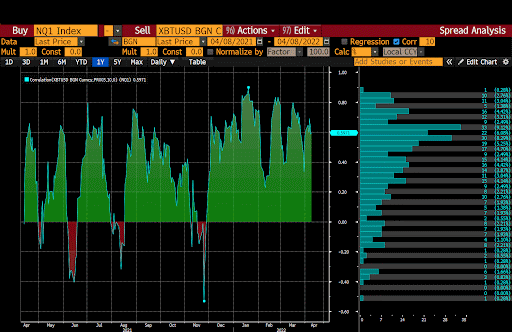
Bitcoin vs. NDX 30-day correlation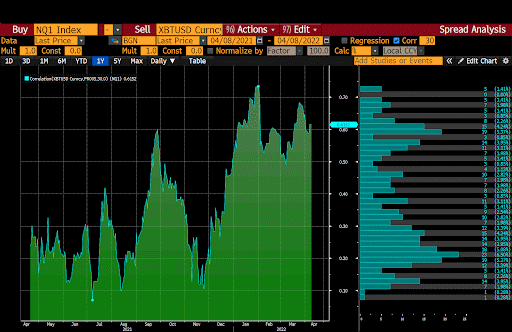 Bitcoin vs. NDX 90-day correlation
 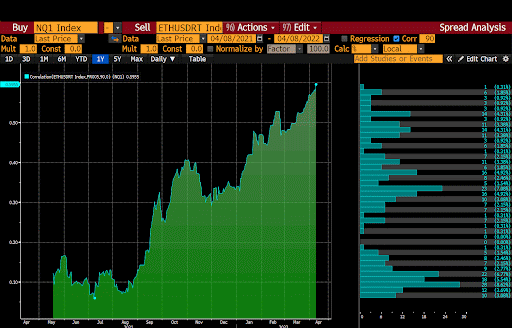 Ether vs. NDX 10-day correlation
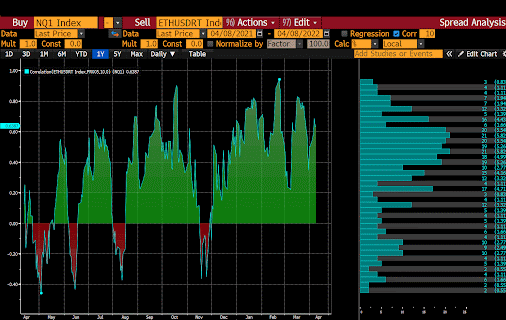 Ether vs. NDX 30-day correlation
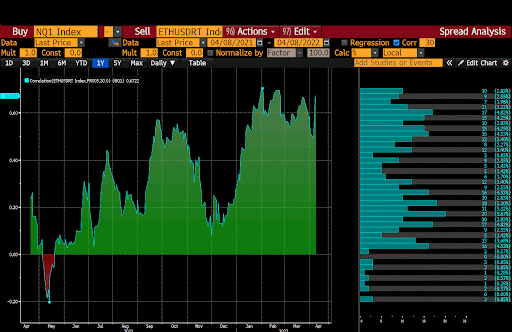 Ether vs. NDX 90-day correlation
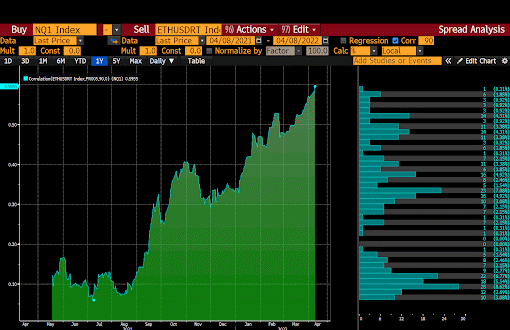
The short-term (10-day) correlation is high, and the medium term (30-day and 90-day) correlations are moving up and to the right. This is not what we want. For me to hoist the flag in support of selling fiat and buying crypto in advance of an NDX meltdown (30% to 50% drawdown), correlations across all time frames need to trend demonstratively lower.
As long as the 10-day correlation stays high, we must stay defensive on our crypto positioning. If you believe in unicorns, the Lloch Nness Mmonster, and the Easter Bunny, then it is possible that you believe big tech will not suffer due to rising nominal interest rates, worsening global fiat liquidity conditions, and falling economic growth. But this is crypto, and magic internet money corrupts the brain so let me provide more pictorial evidence in an attempt to sober you up.
Free Monay!
Roaul Pal makes a very convincing– and I believe, at least on a long-term basis, correct – argument that computers and the internet ushered humanity into an exponential age. In this age, valuation is based not on discounted future cash flows, but Metcalfe’s law (a principle that says when it comes to networks, users = value).
I have no issue with that, but when money is cheap (or nearly free), investors like to act like we are on the cusp of an amazing techno utopia that is actually many years away (see: the Metaverse). This act of forecasting the bright future for a cheap price, due to low interest rates, allows investors to justify paying insane revenue multiples for various tech companies.
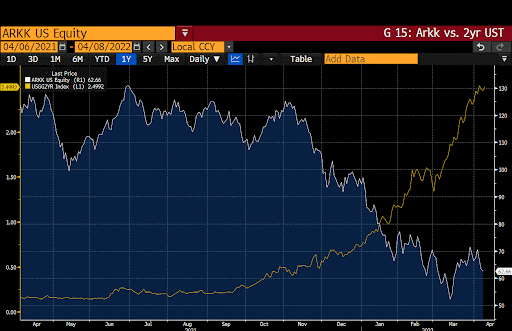
This is a graph of the ARKK price performance (in yellow) vs. the US Treasury 2-year yield (in white).
When investors’ cost of funds rises, seeing real earnings that can translate into dividends suddenly becomes much more important. Take a look at this beauty of a chart that depicts the 2-year US Treasury yield against the ARKK Innovation Fund. Cathie Wood is a gangsta, but her bet is on a group of companies – many of whom are unprofitable – to flourish in the exponential age. ARKK, for all its glory, cannot escape the jaws of the time value of money.
NDX hasn’t succumbed quite as badly, but that’s only because it is heavily weighted towards the few profitable tech companies that dominate the market from a market capitalisation standpoint. Apple, Microsoft, Amazon, Tesla, and Google make up slightly over 40% of the index, and their stock prices are slightly lower than all-time highs hit in the previous months.
Ski Boots
The most important piece of equipment to own outright when skiing are your boots. They are the direct connection between your body and the ski. Back in the day when I was a young lad, I raced, and my ski boots were excruciatingly painful. I can now afford comfort and performance, and my feet aren’t crying out for help on every turn.
Tight ski boots are uncomfortable, just like tight monetary conditions. The Fed and most other major central banks are currently engaged in a kabuki theatrical performance of “fighting inflation”. As I have said many times, the goal is not to actually fight inflation, but to appear to fight inflation so that domestic politicians can survive an angry populace that works more but can afford less. Central bankers must tighten, tighten, and tighten some more, but not too much – because positive real rates would completely destroy the debt-based global economy. The recent Fed minutes clearly demonstrate that even uber-doves like Brainard now call for “aggressive” action to reduce the size of the balance sheet and raise policy rates.
“It is of paramount importance to get inflation down. Accordingly, the Committee will continue tightening monetary policy methodically through a series of interest rate increases and by starting to reduce the balance sheet at a rapid pace as soon as our May meeting. Given that the recovery has been considerably stronger and faster than in the previous cycle, I expect the balance sheet to shrink considerably more rapidly than in the previous recovery”.
Brainard Speech on inflation and the recovery
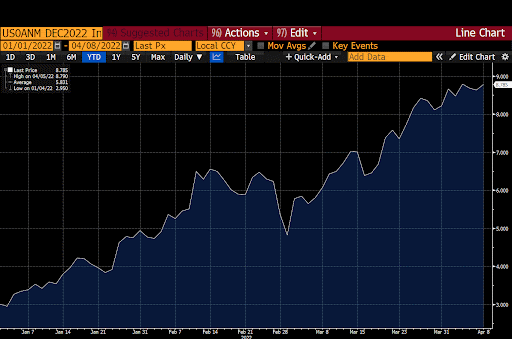
This is a graph depicting the change in the market’s expectation of the number of rate hikes gleaned from the Fed Funds Futures expiring in December 2022. As you can see, the market tripled its expectation for the total number of rate hikes in 2022 from 3 to 9. The Fed ain’t playin’.
China Can’t Save You
In the aftermath of the 2008 Global Financial Crisis, China stepped up to the plate and re-inflated the world. China embarked on one of humanity’s biggest quests to print money and build stuff, regardless of whether that stuff generated real economic value for its citizens. If you pay people to dig holes, fill them back up, then dig again ad infinitum, that is a perpetual GDP growth machine. Yippie! That is what China did on a colossal scale. Bridges to nowhere, empty apartments– anything to goose growth and employ folks. The externality was a massive jump in indebtedness at the sovereign level.
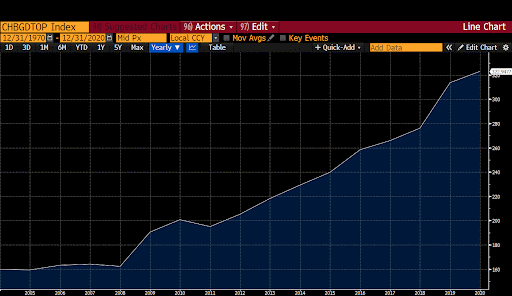 This time, however, Beijing is not likely to repeat that folly, and vs. its Western peers it has barely stimulated its economy in the wake of COVID. We all know how that worked out…
As global growth wanes and enters outright decline in the face of rising energy costs, Beijing cannot be counted upon to save Western capital markets with more fiat wampum and economic “growth”.
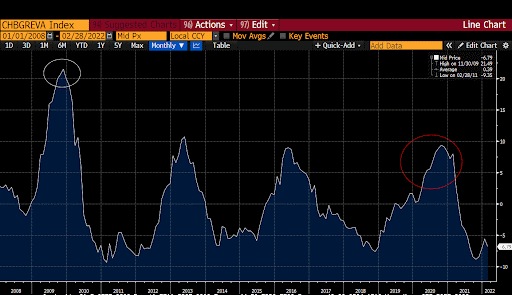 Look at the credit spike in 2008 / 2009, and observe the much lower spike post-March 2020. Beijing knows it has a debt problem, and appears to be attempting to not make it worse. The West is on its own.
Kuroda-san’s Bazooka
Japan already reflects the rest of the world’s tomorrow. (As an aside, I highly recommend reading Professor Werner’s book, “Princes of the Yen”. I have watched the documentary, but have yet to read the paperback book). The BOJ flails at windmills in an attempt to generate inflation to rectify the fact that couples don’t want kids.
The “official” government inflation statistics paint a picture of a country mired in deflation. However, Japan imports most of its energy. So while the end consumer pays more to eat and move around, prices of officially indexed goods have barely risen since the start of COVID. The rest of the developed world ain’t so lucky.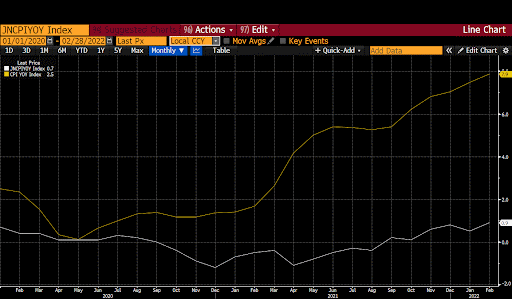
This is a chart that contrasts the US Consumer Price Index (yellow line) with its Japanese counterpart (white line).
Inflation continues to exist below the BOJ’s target, which emboldens Kuroda-san to continue Yield Curve Control (YCC). In an effort to spur the moribund Japanese economy, the BOJ caps the yield on the 10-year government bond (JGB’s) at no greater than 0.25%. They accomplish this by pledging to buy an unlimited amount of government bonds with printed Yen.
The holy trinity of interest rates vs. exchange rate vs. capital account openness strikes again. Japan has an open capital account and price fixes its government bond yields, causing the Yen to weaken (which it has done, pushing the USDJPY higher). The reason the currency weakened is because the market tested Kuroda-san recently on whether he had the gumption to buy JGB’s in unlimited size should the yield top 0.25%. He put the BOJ’s money printer into action, bought bonds, and yields came back in line.
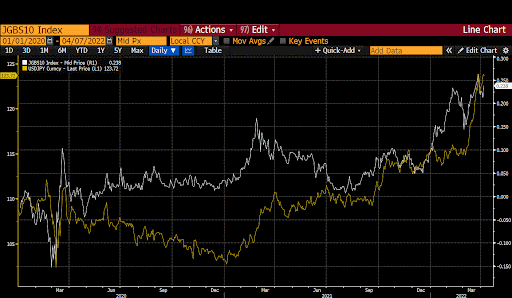
The JGB yield (white line) vs. USDJPY (yellow line).
In theory, the BOJ could provide the cheap credit that global risk asset market’s need to continue defying gravity. The carry trade is as follows:
- Borrow JPY cheap. The JGB’s 10-year yield is 0.24% vs. the UST 10-year yield of 2.58%. You have picked up 224bps of yield for 10 years– that’s huge.
- Sell your borrowed JPY, purchase USD. But do not hedge the currency risk (you hedge on the left-hand side), as JPY is freely convertible. The forward points are negative because of covered interest rate parity. (Google is your friend if that is all Klingon to you).
- Buy US-listed stonks, preferably some big tech names.
- You have now funded your stonks with cheaper money.
- If JPY strengthens, you lose money, but that’s not your problem if you are a fiduciary. When this blows up in your face, just ask your pliant central bank for a bailout. But you already got your bonus – YAHTZEE!
If enough large financial institutions put on this JPY carry trade, they can lower their cost of funds. With a lower cost of funds, purchase of long-duration tech stocks become more attractive. This activity, if done en masse, creates buy pressure.
I am a subscriber to Felix Zulauf’s research. He is so on-point. His general thesis is that the tightening of liquidity globally will lead to a deeeeep, short-term correction in global equities.
I recently asked him whether the BOJ providing unlimited JPY liquidity at rock-bottom rates negated any of this thesis of tightening global liquidity conditions. To paraphrase his answer, “No”. He argues that the BOJ is not large enough in their monetary support to counter the draining of liquidity initiated by the Fed.The GOAT has spoken, and I shall listen.
Technical Analysis for Dummies
If the chart and the fundamentals line up, then technical analysis has value. Otherwise, I mostly believe it’s a convenient tool for confiscating money from traders who are desperate to find a blueprint for making cash money as quickly as possible. Unfortunately, there is no easy “profits” button.
“Oh, Jake,” Brett said, “we could have had such a damned good time together.”
Ahead was a mounted policeman in khaki directing traffic. He raised his baton. The car slowed suddenly pressing Brett against me.
“Yes,” I said. “Isn’t it pretty to think so?”
– The Sun Also Rises, Hemingway
The chart of NDX is UGLY!
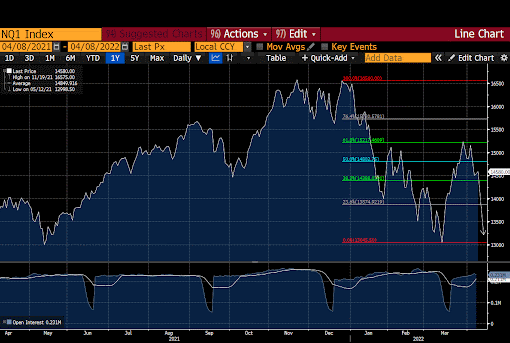
On 27 December 2022, the Nasdaq 100 closed at a high of 16567.50 and then subsequently hit a local low of 13046.64. Using the tried and tested Fibonacci Retracement, NDX failed to break through the 61.8% retracement on the bounce. A few days later it attempted to break that resistance level again, failed, and has continued lower ever since.
The chart tells me the NDX will continue lower, test its local low, and break decidedly below it. I believe the next stop after that is to test 10,000. Where oh where is the Fed put?
It’s Time for the Percolator

The Fed is done caring about whether equity investors are up on the year. That game is over. It’s all about credit.
Danielle DiMartino Booth runs Quill Intelligence, another high-quality research outfit. She did time as a staffer at the Fed, and produces very high-quality research and has great insight into how various Fed governors think. I had a phone conversation with her last week, and asked where the Fed put is. She responded that Jay Powell is a credit guy, and is deeply concerned about financial contagion in the corporate bond markets. She reminded me that the Fed effectively nationalised the US corporate credit markets by backstopping BBB-rated companies during the COVID March 2020 crash. Absent this support, the corporate borrowing markets would have a supporting role in the film Frozen.
She remarked that when the BBB-rate US corporate 2-year vs. 10-year yield curve inverts, the Fed will spring into action.
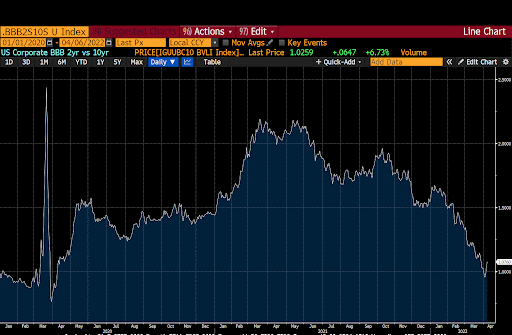
As this chart clearly shows, at +1%, the spread has a bit farther to fall before it is inverted. When this curve inverts– and I believe it will, due to softening global demand driven by commodity price inflation from the Russian / Ukraine conflict– how far down the hole will the NDX have fallen?
Down 30%? … Down 50%? … your guess is as good as mine. But let’s be clear– the Fed isn’t planning to grow its balance sheet again any time soon, meaning equities ain’t going any higher.
When War Over?
Any mass media produced during wartime by any flag’s pliant news organisations is mostly propaganda. Instead, I rely on paid research publications whose goal isn’t to influence my opinion, but rather to help me make informed investment decisions based on objective facts.
Again, enter Mr. Zulauf, who, on his most recent Q1 2022 update in mid-March, gave an interesting view on the status of the war.
TLDR:
- Russian forces are slowly encircling Ukrainian cities with sea access.
- Russia will then post up, wait it out, and not directly engage Kyiv.
- How long can Ukraine, receiving supplies from the west, last before they capitulate?
- How long can Europe last without Russian energy and food, before they instruct Zelensky it’s time to stand down?
- This analysis is moot if the West escalates with actions such as a “no-fly-zone” over Ukraine. Then, all bets are off, but that certainly won’t lead to the war ending.
The flip side, if you are to believe Western mass media, is how long can Russia last without the ability to trade with the West and receive “hard” currency. A lot of that depends on whether the Global South cooperates with Western sanctions on Russian energy and food exports.
Anti-inflation protests have broken out in Sri Lanka (cabinet resigned amid public pressure), Peru (army is being called into quell dissent), U.K., Spain, Belgium, Germany, Italy, Albania, Armenia, Bulgaria, Cyprus, Serbia, and Moldova (source 13D Research). How long before this inflation-driven unrest spreads to other countries? If you were a leader of such a country, and you cared about your life and your job as a politician, would you rather import cheaper Russian energy and food, or sanction it and watch your people overthrow you?
Quick semi-related tangent:
After writing the first draft of this article, I had coffee with my favourite volatility hedge fund manager. We spent 90 minutes talking about many things featured in this article. He commented that in the aftermath of the 1997 Asian financial crisis, every single affected Asian government that had been in place since WWII fell due to rising inflation caused by the crisis. The only government that survived was that of Mahatir in Malaysia, because he closed the country off to the world in order to remain in power.
The takeaway from the above oversimplified analysis is that the war ain’t ending anytime soon. And if the war ends, it probably means some sort of partition of Ukraine into two sections – one Western and one Russian. If that happens, would the West reward Russia by immediately removing sanctions? If you believe that, I’ve got some Bitconnect you might want to buy.
Given that Russia exports significant amounts of energy and food to the world, the trade disruptions that raise transportation costs and thus prices will continue with no abatement. Please read the last two truly epic Zoltan Pozar pieces about how difficult and expensive it is to re-route commodities to willing buyers in the Global South now that Europe has cancelled Russian exports. It will leave you convinced that higher prices are here to stay, and global growth – which is a derivative of the cost of energy– must slow. Therefore, slowing growth will take global equities down with it, unless buttressed by ample liquidity from central bankers who are supposed to be fighting inflation.
Crypto Crash Helmet
Let’s put it all together.
- Bitcoin and Ether are highly correlated to the Nasdaq 100. If the NDX tanks, it will take crypto down with it.
- NDX, like all long-duration assets, benefits from falling interest rates.
- Unprofitable tech, such as ARKK, got smacked as UST 2-year rates rose. Big tech (NDX) has been saved for now by a few profitable names, but even it has traded lower.
- The Fed and all other central banks are fighting inflation, and must therefore tighten monetary conditions, not loosen them.
- Japan, even though it is pursuing accommodative monetary policy, can’t save the world’s risk asset markets because its bazooka is a pea shooter when compared to the Fed’s.
- The NDX bounce failed at the 61.8% Fibonacci Retracement level, and will continue lower towards and below 10,000.
- The Fed put is not based on equities but on US corporate credit markets, which are still healthy-ish… Watch the BBB 2s / 10s spread for a sign the Fed is about to abort the mission and juice the markets higher once more.
- Global growth will decline on higher commodity prices driven by the continuation and possible escalation of the Russia / Ukraine war. This, in absence of accommodative central banks, will also weigh negatively on stonks.
- Ipso facto, NDX will fall, and so will crypto.
Let me repeat– the crypto capital markets are the only free markets left globally. As such, they will lead equities lower as we head into the downturn, and lead equities higher as we work our way out of it. Bitcoin and Ether will bottom well before the Fed acts and U-turns its policy from tight to loose.
The great thing about a 24/7 market accessible to all humans with an internet connection is that things happen quickly. By the end of the second quarter in June of this year, I believe Bitcoin and Ether will have tested these levels:
Bitcoin: $30,000
Ether: $2,500
There isn’t much science to these numbers other than a gut feeling. The annoying part is that there are a number of altcoins I have begun to accumulate because the prices are quite attractive. Even though some of these coins are already down 75% from their all-time high, I don’t believe even they can escape the coming crypto carnage. As such, I am buying crash June 2022 puts on both Bitcoin and Ether.
Nothing is certain – I only ascribe probabilities to outcomes and trade accordingly. I fully believe there’s a chance my market prognosis might be wrong. That is fine – in that case I only lose the option premium paid on my crash protection. I will be wrong if the correlation between Bitcoin / Ether and NDX starts dropping before a crash in risk asset markets. I’m perfectly okay with that outcome, as I’m already in a long crypto position. This analysis is purely an attempt to trade a short-term situation that I believe will transpire in risk markets and hedge purchases of attractively priced altcoins.
There are many crypto market pundits who believe the worst is over. I believe they ignore the inconvenient truth that the crypto capital markets are currently just a 24/7 Spooo’s and Qqq’s indicator and do not trade on the fundamentals of being peer-to-peer, decentralised, censorship-resistant digital networks designed for the transfer of money.
Related
The post appeared first on Blog BitMex


