
In the fast-paced world of crypto trading, mastering the art of reading and interpreting market signals is crucial for success. Whether you’re a seasoned trader or just getting started, understanding the diverse range of trading indicators for you to leverage is essential in guiding your trading decisions.
This guide is your one-stop shop to learning about and implementing the most important trading indicators in crypto:
- On-Balance Volume (OBV)
- Relative Strength Index (RSI)
- Moving Average Convergence Divergence (MACD)
- Macroeconomic indicators
- On-chain data
By the end of this article, you’ll have a comprehensive understanding of each of the indicators, and how to leverage them on BitMEX, to enhance your trading strategy and make informed decisions in any market environment.
Let’s dive in.
On-Balance Volume (OBV) Indicator
Imagine unlocking the secrets of crypto trading, capturing market moves, and maximising your gains by anticipating trends before they happen. The On-Balance Volume (OBV) indicator is a way to use volume analysis to get ahead of markets.
The OBV indicator uses the cumulative volume of an asset to signal upcoming trend reversals or breakouts. This momentum indicator provides valuable insights into market movements, which can help you anticipate price changes before they become apparent in the price action.
TL;DR
- Cumulative Volume: OBV is the cumulative sum of volume flowing in and out of a security, acting as a leading indicator to reveal the actions of large market players (e.g. whales).
- Divergences: Discrepancies between OBV and price action can indicate potential near-term price reversals.
- False Signals: OBV can produce false signals due to variations in parameters, time periods, and the asset itself.
What is the OBV Indicator?
The OBV indicator, introduced by Joe Granville in 1963, is designed to indicate whether money is flowing in or out of an asset. Known as the “smart money indicator,” it aims to reveal the actions of large players in the market before these actions are reflected in the price action.
This can be particularly useful in the crypto market to identify whale movements.
How to Calculate the OBV Indicator
OBV is calculated by summing the volume based on the closing prices of an asset.
- If today’s closing price is greater than yesterday’s: Current OBV = Previous OBV + Today’s Volume
- If today’s closing price is less than yesterday’s: Current OBV = Previous OBV – Today’s Volume
- If today’s closing price is equal to yesterday’s: Current OBV = Previous OBV
For crypto trading, you can easily pull up the OBV indicator on platforms like GeckoTerminal by selecting the desired liquidity pool, choosing “indicators,” and typing in “OBV”.
Revealing Standard and Hidden Divergences
The OBV indicator can reveal both standard and hidden divergences, signaling potential price reversals or continuations.
Standard Divergences
- Bullish Divergence: Occurs when the price reaches a lower low (LL) and the OBV forms a higher low (HL), indicating a potential upward reversal.
- Bearish Divergence: Occurs when the price reaches a higher high (HH) and the OBV forms a lower high (LH), indicating a potential downward reversal.
Hidden Divergences
- Bullish Hidden Divergence: Occurs when the price forms a higher low (HL) and the OBV forms a lower low (LL), signalling a potential upward continuation.
- Bearish Hidden Divergence: Occurs when the price forms a lower high (LH) and the OBV forms a higher high (HH), signalling a potential downward continuation.
Separating the OBV From Other Volume Indicators
Accumulation/Distribution Line (A/D)
The A/D line measures the flow of money into and out of an asset, accounting for both opening and closing prices. It uses the Money Flow Multiplier (MFM) and Money Flow Volume (MFV) to calculate the current A/D line. Unlike the OBV, the A/D line does not reflect price gaps, potentially leading to inaccuracies in reflecting price action.
Ease of Movement (EOM)
The EOM indicator reflects the amount of volume required to move an asset’s price. It is plotted on a line graph with a midpoint of zero and is often smoothed with a 14-day moving average. High values indicate upward price movement on light volume, while low values indicate downward movement on light volume. The EOM is used to confirm signals from other indicators and to determine states of divergence.
Applying OBV to BitMEX Charts
Here’s a step-by-step guide on how to add the OBV to your chart on BitMEX:
- Choose Indicators: Select “Indicators” from the chart options.

2. Search for OBV: Type “OBV” in the search bar.
3. Select OBV: Choose the OBV from the list of momentum indicators, and it will automatically apply to your chart.

The OBV indicator offers crypto traders a powerful tool to anticipate market movements by analysing volume flows. By understanding and leveraging OBV, traders can gain insights into potential trend reversals and breakouts, in order to make more informed trading decisions.
While OBV is a robust standalone indicator, its effectiveness is best shown when integrated with other volume indicators like the A/D line and EOM. OBV is the key to better navigating the volatile crypto markets, identifying identifying high-probability opportunities and managing risks effectively.
Relative Strength Index (RSI) Indicator
Accurately identifying overbought and oversold market conditions can be a powerful edge for any trader. The Relative Strength Index (RSI) is one of the most widely-used technical indicators to help traders gauge market momentum and price sentiment.
By understanding how RSI works and how to interpret its signals, you can gain valuable insights into when an asset may be approaching a potential reversal or continuation.
TL;DR
- Momentum Measurement: RSI measures the speed and change of price movements, helping identify overbought and oversold conditions.
- Divergences: Discrepancies between RSI and price can signal potential reversals.
- Wide Applicability: Suitable for various timeframes, from minutes to weeks, making it versatile for different trading strategies.
What is the RSI (Relative Strength Index) Indicator?
The RSI, created by J. Welles Wilder in 1978, is a momentum oscillator that measures the speed and change of price movements. It ranges from 0 to 100 and helps traders identify overbought or oversold conditions in the market. This indicator is widely used by crypto traders due to its effectiveness in predicting price reversals and trend continuations.
How to Calculate the RSI Indicator
The formula for calculating RSI is as follows:
RSI =100-[100/(1+(Average gain of n days the market closed up/ Average loss of n days the market closed down)]
The RSI is typically calculated over a 14-day period timeframe, but this can be adjusted to suit different trading strategies.
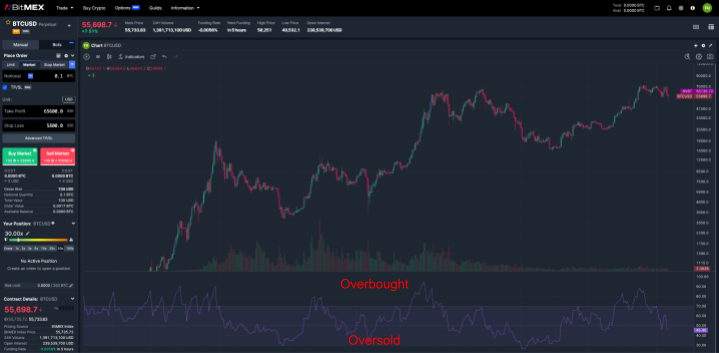
How to Read the RSI Indicator
The RSI provides insights into whether an asset is overbought or oversold…
- Overbought: RSI above 70 indicates the asset may be overbought and could be due for a price correction.
- Oversold: RSI below 30 suggests the asset may be oversold and could experience a price increase.
Applying RSI to BitMEX Charts
Here’s a step-by-step guide on how to add the RSI to your chart on BitMEX.
- Choose Indicators: Select “Indicators” from the chart options.
2. Search for RSI: Type “Relative Strength Index” in the search bar.
3. Select RSI: Choose the RSI from the list of momentum indicators, and it will automatically apply to your chart.

When to Use RSI for Crypto Trading
Identify Entry and Exit Points
RSI helps traders determine when to enter or exit a trade.
For example, a trader might wait for the RSI to drop below 30 to buy (indicating oversold conditions) and sell when it rises above 70 (indicating overbought conditions).
For Swing Trading
Swing traders use RSI to capture short-term price movements. They might buy when RSI crosses below 30 and sell when it crosses above 70, taking advantage of price swings.
Identify Support and Resistance
RSI can help identify key support and resistance levels before they become apparent on the price chart. Support is a price level where a downward trend can pause due to a concentration of buying interest, while resistance is a price level where a rising trend can pause due to a concentration of selling interest.
Understanding Divergences and Convergences
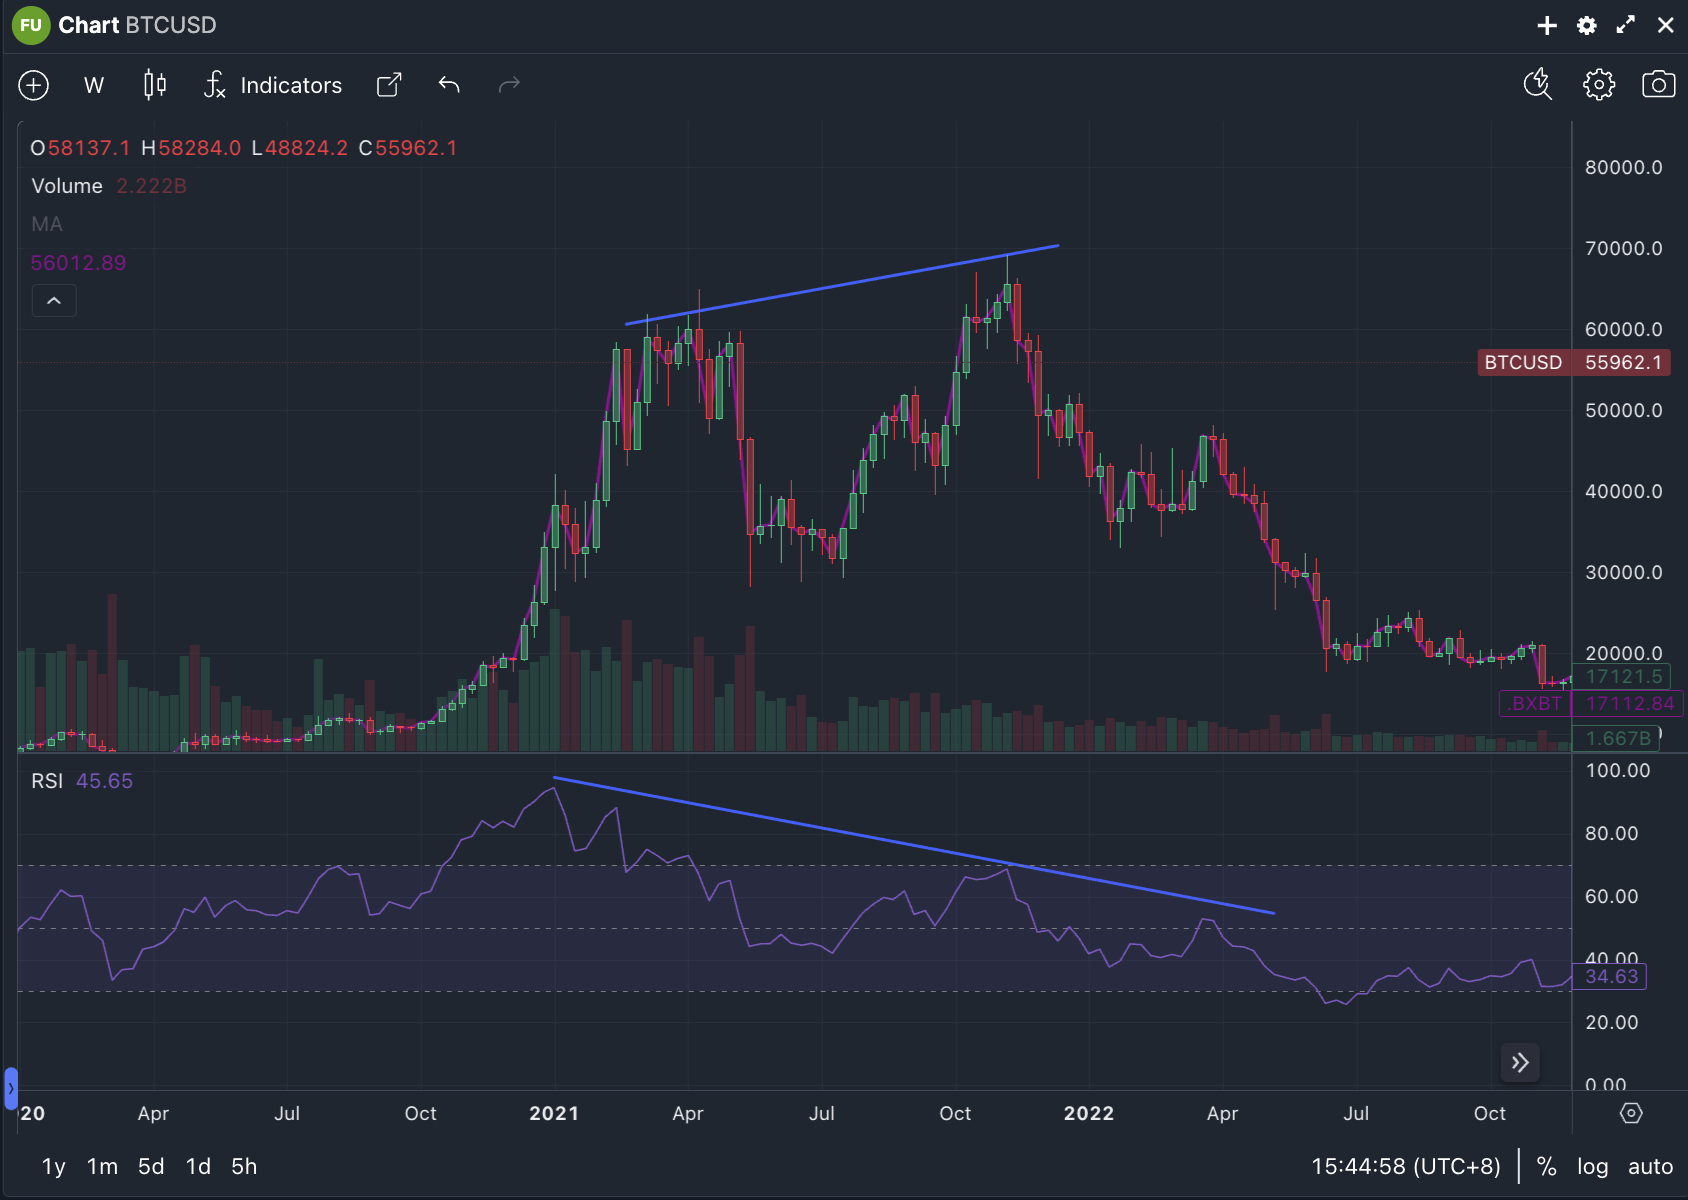
Bullish and Bearish Divergence
- Bullish Divergence: Occurs when the price makes a lower low, but RSI makes a higher low, indicating potential upward reversal.
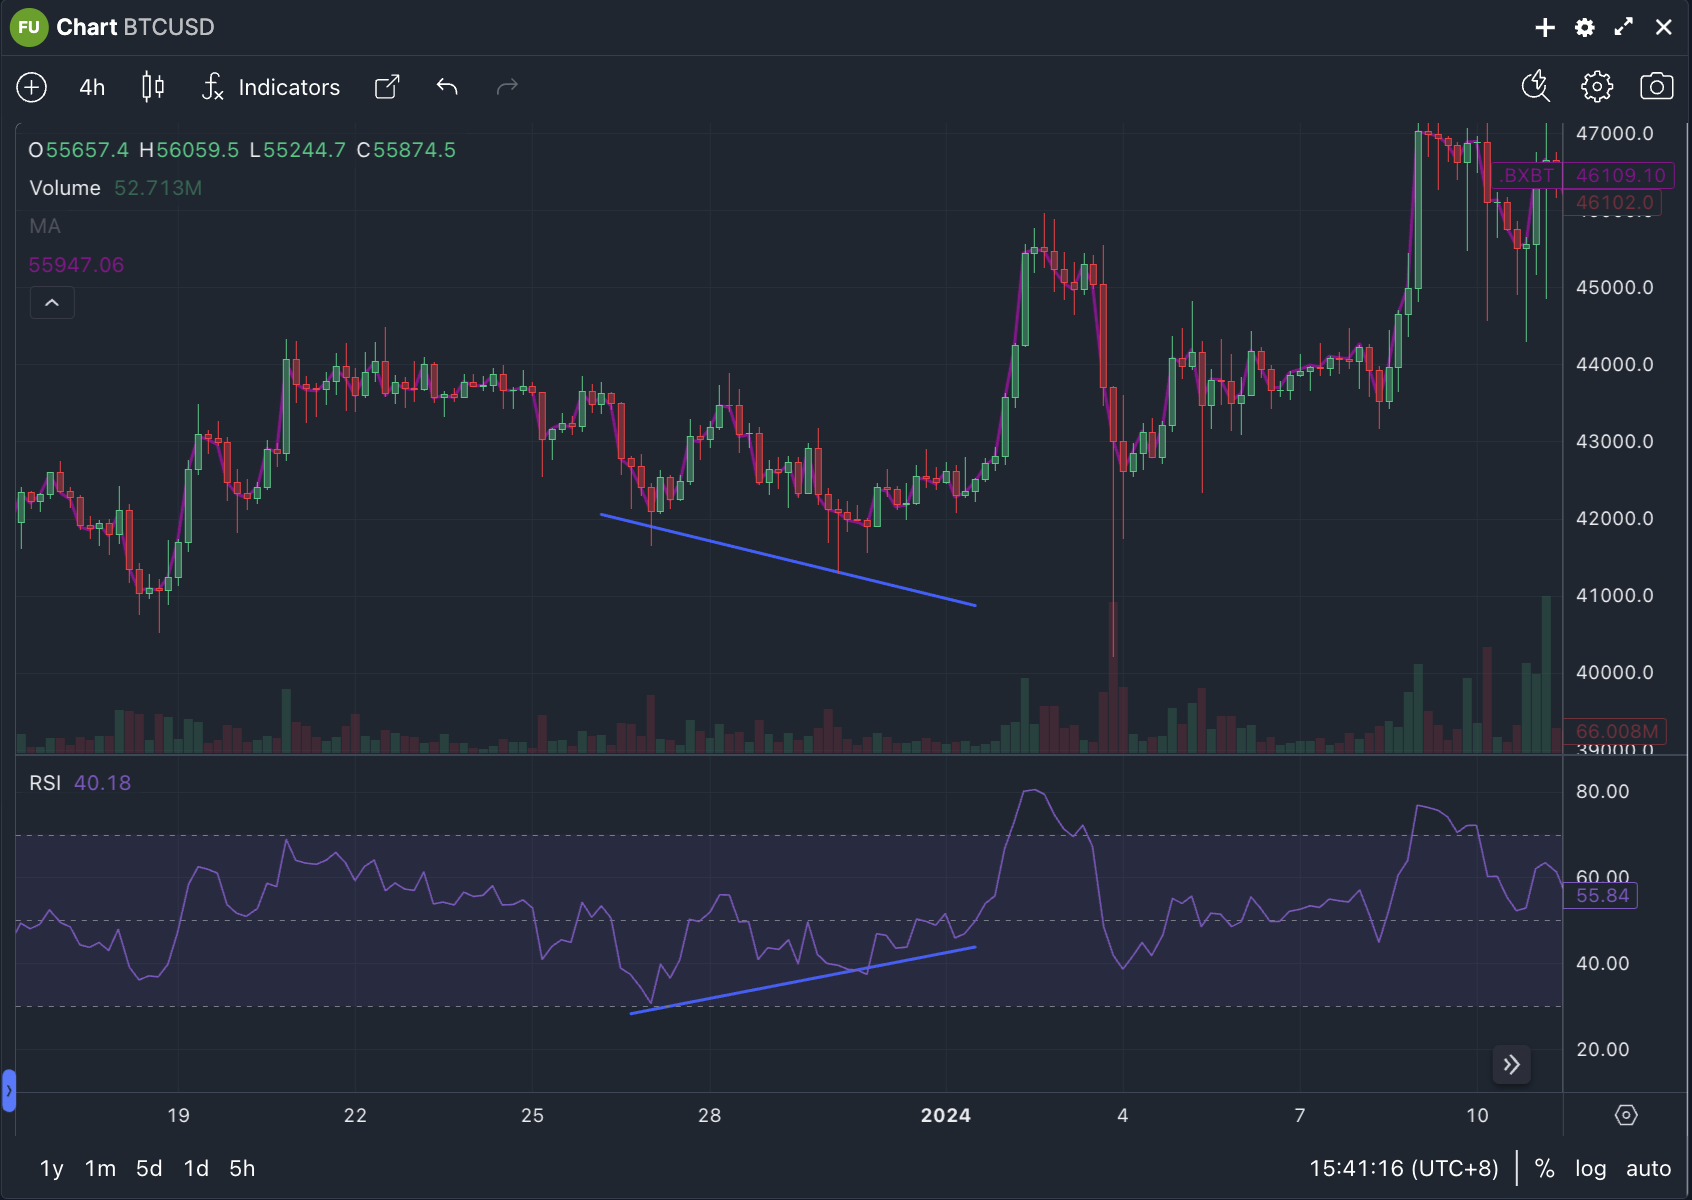
- Bearish Divergence: Occurs when the price makes a higher high, but RSI makes a lower high, signaling potential downward reversal.
Convergence
Convergence happens when the price and RSI move in the same direction, confirming the current trend.
Historic Bitcoin RSI
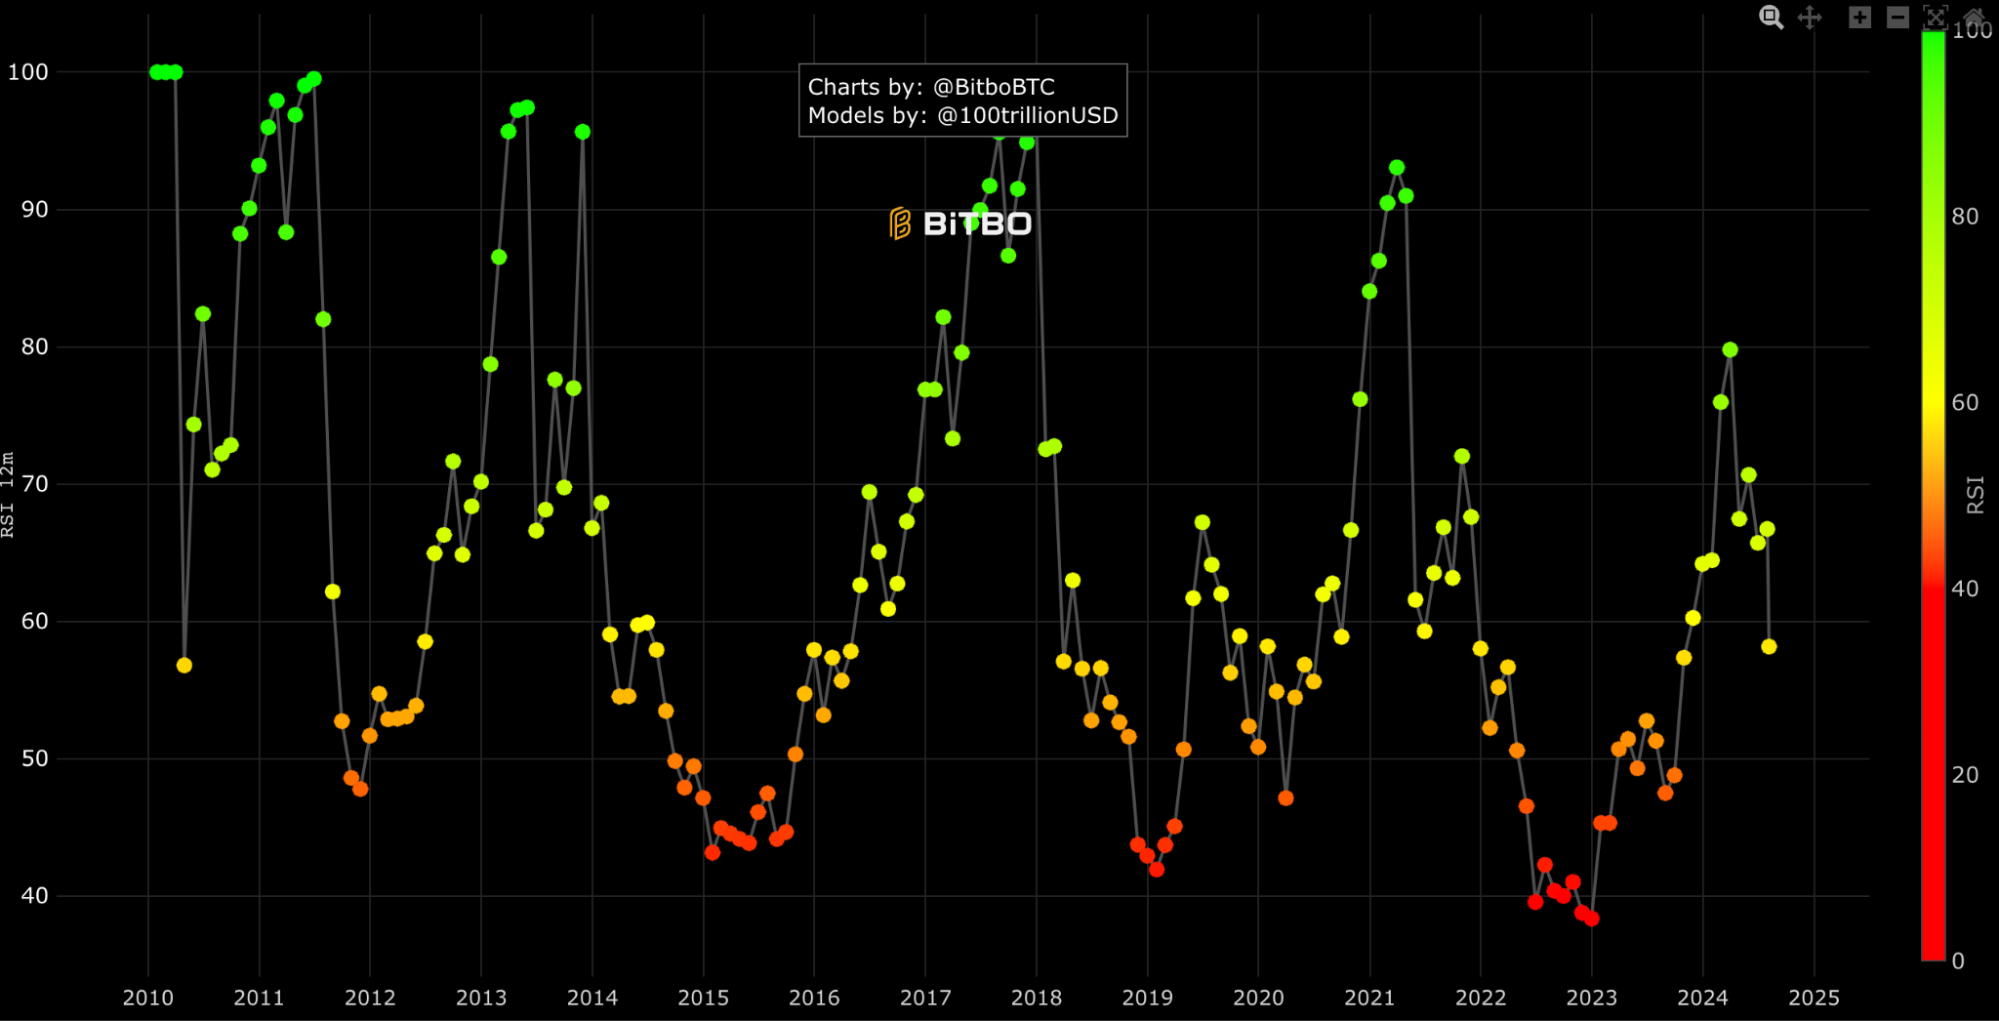
Source: Bitbo
Enhancing Trading Strategies with RSI
While RSI is a powerful tool, it should not be used in isolation. Combining RSI with other indicators like Moving Average Convergence Divergence (MACD), Stochastic Oscillator, and trend lines can increase the reliability of trading signals.
This multi-indicator approach reduces the likelihood of false signals and enhances overall trading strategy.
The Relative Strength Index (RSI) is a valuable tool for crypto traders, offering insights into market momentum and helping to identify overbought and oversold conditions. By understanding and applying RSI effectively, traders can make more informed decisions, optimise their entry and exit points, and enhance their trading strategies.
Whether you’re a day trader or a swing trader, integrating RSI into your analysis can provide a significant edge in the dynamic world of crypto trading.
Moving Average Convergence Divergence (MACD)
Crypto trading can be a whirlwind – which is why the identifying the right tools to use is even more important to navigate markets. One such tool, the Moving Average Convergence Divergence (MACD), has been a staple in TradFi for nearly 50 years. Now, it’s making waves in the crypto world, helping traders spot trend changes and maximise their profits.
TL;DR
- MACD is a momentum indicator that helps to identify trend direction and strength through three main components: MACD line, signal line, and histogram.
- To fully utilise MACD, it’s essentially to spot for crossovers, divergences, and zero-line crossings to identify trends.
- For instance, a buy signal occurs when the MACD line crosses above the signal line. A sell signal occurs when the MACD line crosses below the signal line. For advanced traders, the MACD displays hidden divergences.
- The MACD indicator is intuitive to use and helpful for spotting trends. However, note that it is a lagging indicator and can generate false signals.
What is the MACD Indicator?
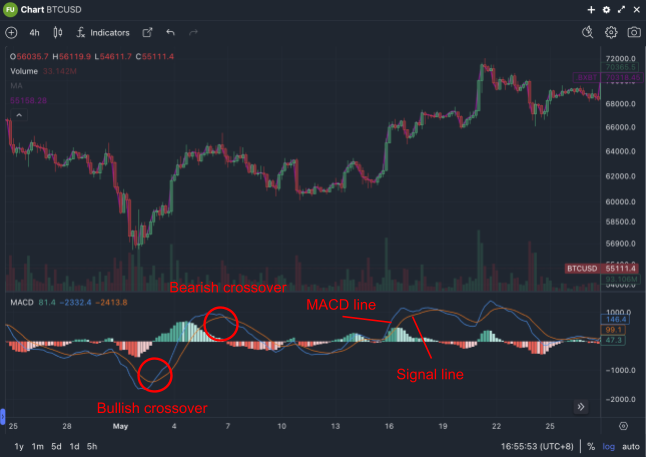
The MACD is a momentum indicator that reveals the current direction and strength of a cryptocurrency’s trend. It consists of two main components: the MACD line and the signal line.
When the MACD line crosses above the signal line, it signals a bullish trend. Conversely, a cross below indicates a bearish trend. A histogram is also part of the MACD, representing the difference between these two lines and quickly showing the trend’s strength and direction.
How Do Crypto Traders Use the MACD Indicator?
- Signal Line Crossover
- Buy Signal: When the MACD line crosses above the signal line, traders see this as a cue to buy.
- Sell Signal: A cross below the signal line suggests it’s time to sell.
- Zero Line Crossover
- Bullish Signal: When the MACD moves above the zero line, it indicates the shorter-term EMA is greater than the longer-term EMA.
- Bearish Signal: A move below the zero line suggests the opposite, signaling a potential downturn.
- Bullish and Bearish Divergence
- Bullish Divergence: When a token’s price makes a lower low, but the MACD makes a higher low, it indicates the downward trend might be slowing, signaling a buying opportunity.
- Bearish Divergence: When the price makes a higher high, but the MACD makes a lower high, it suggests weakening buy pressure and potential for a price reversal.
While MACD is a powerful tool, it’s not foolproof. It relies on historical data and cannot predict future market moves with certainty. Always manage your risks and avoid relying solely on one indicator. Combine MACD with other trading indicators and analysis methods to make well-informed decisions.
Applying MACD to BitMEX Charts
Here’s a step-by-step guide on how to add the MACD indicator to your charts on BitMEX:
- Choose Indicators: Select “Indicators” from the chart options.
2. Search for MACD: Type “MACD” in the search bar.

3. Select MACD: Choose the MACD from the list of momentum indicators, and it will automatically apply to your chart.
The MACD indicator is an essential tool for crypto traders. It’s simple yet packed with insights into market momentum and trend direction. By understanding and applying MACD signals—such as signal line crossovers, zero line crossovers, and divergences—you can trade smarter and enhance your crypto trading strategy.
Always remember to manage your risks and seek confluence with other forms of analysis for the best results.
Macroeconomic Indicators
If you’ve been trading crypto for some time, you may have come across the saying “money printer go brrrr”, which refers to the central banks engaging in Quantitative Easing (QE) – the process of expanding the money supply to stimulate the economy.
While humorous, it can be a strong indicator of the impact that monetary policy can have on the financial markets, including crypto.
TL;DR
- Macroeconomic data such as interest rates are essential towards crypto as it’s seen as a function of global liquidity.
- A growing economy and lower interest rates generally boost crypto investment, while economic decline and higher rates can suppress it.
- Rising inflation can increase crypto prices, but excessive inflation might lead to interest rate hikes, dampening demand.
- High unemployment and weak consumer spending negatively affect crypto markets, while strong economic confidence supports them.
- Monitoring key macro indicators helps traders anticipate market shifts and make better-informed decisions as the market is forward looking.

Cryptocurrency is widely considered to be a function of global liquidity and the macroeconomic environment. Navigating the turbulent waters of the cryptocurrency market can be daunting, but understanding macroeconomic indicators can give you a significant edge.
These indicators, which have long guided TradFi, are now proving essential for crypto traders aiming to make informed decisions and maximise their profits. This part of the guide will break down key macroeconomic indicators to watch and how to utilise them to your trading advantage.
Why Macroeconomics Matters
Macroeconomics focuses on the overall economy’s behavior, offering insights that can prevent panic during market dips and help you prepare for market cycles. Understanding these economic trends allows you to invest wisely, increase profitability, and sleep soundly, even in volatile markets.
Key Macroeconomic Indicators
1. GDP Growth Rate
What is it? GDP measures the total value of all goods and services produced within a country. It’s a snapshot of the economy’s health.
Impact on Crypto? High or growing GDP indicates a robust economy, leading to increased spending and investment in assets like cryptocurrencies. Conversely, a declining GDP can reduce investment and lower crypto prices.
2. Inflation and Consumer Price Index (CPI)
What is it? Inflation is the rate at which prices for goods and services rise, decreasing purchasing power. CPI measures this inflation.
Impact on Crypto? Rising inflation often leads to higher prices for crypto as investors seek assets that hedge against inflation. However, excessive inflation might prompt central banks to increase interest rates, which can suppress crypto prices.
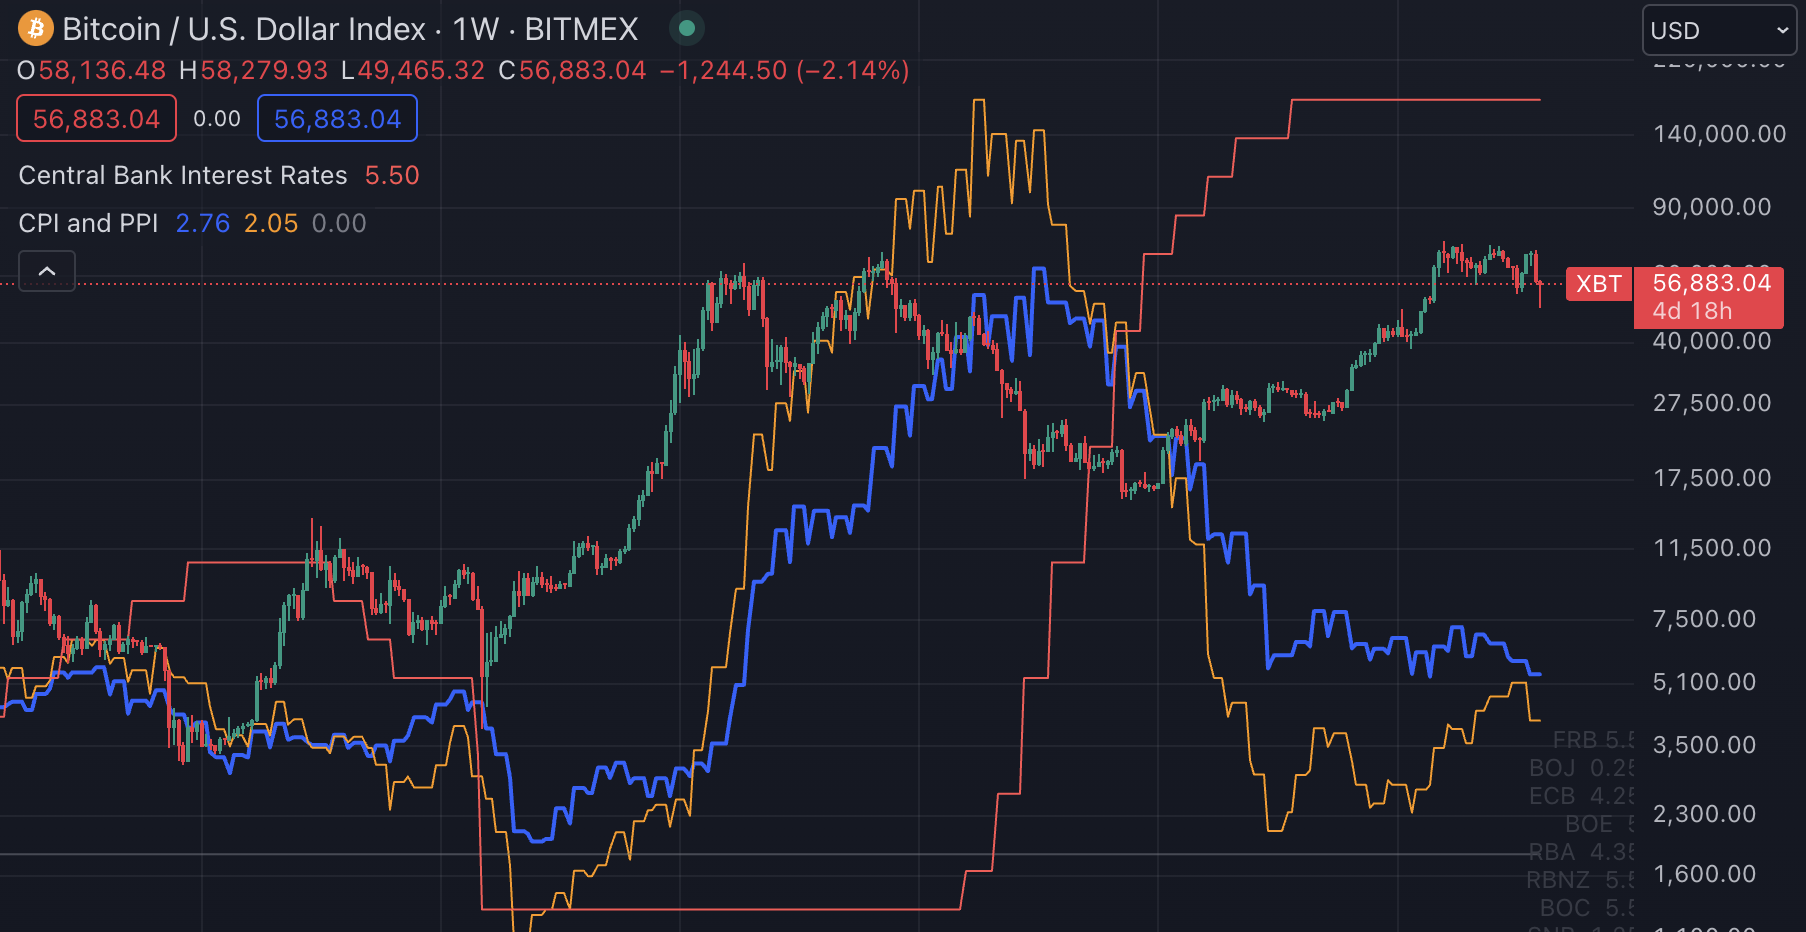
3. Fed Funds Rate and Interest Rates
What is it? The Fed Funds Rate is the interest rate at which banks lend to each other overnight. It’s a key tool for monetary policy.
Impact on Crypto? Lower interest rates encourage borrowing and investing, boosting economic growth and potentially increasing crypto investments. Higher rates can have the opposite effect, making loans expensive and reducing investments in riskier assets like cryptocurrencies.
4. Money Supply (M2)
What is it? M2 includes cash, checking deposits, and easily convertible near money. It’s a measure of the money supply in the economy.
Impact on Crypto? An increasing money supply can boost spending and investment, driving up crypto prices. However, excessive money printing can lead to inflation, diluting currency value and affecting crypto markets.
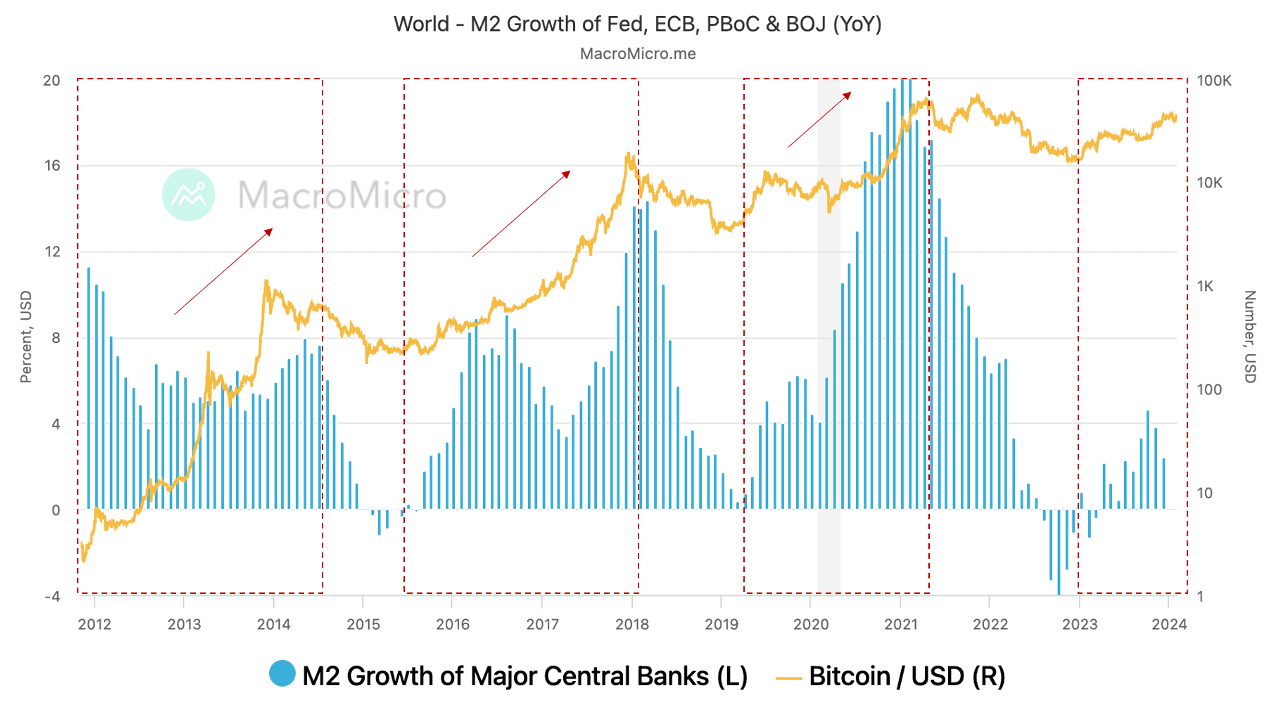
Source: MacroMicro
5. Unemployment Rate
What is it? The percentage of the labor force that is unemployed and actively seeking work.
Impact on Crypto? High unemployment reduces consumer spending and investment, negatively impacting crypto markets. Conversely, lower unemployment boosts economic confidence and investment in crypto.
6. Retail Sales
What is it? Retail sales measure consumer spending on goods and services.
Impact on Crypto? High retail sales indicate strong consumer confidence and economic health, potentially leading to increased crypto investments. Low retail sales can signal economic trouble, reducing investment in crypto.
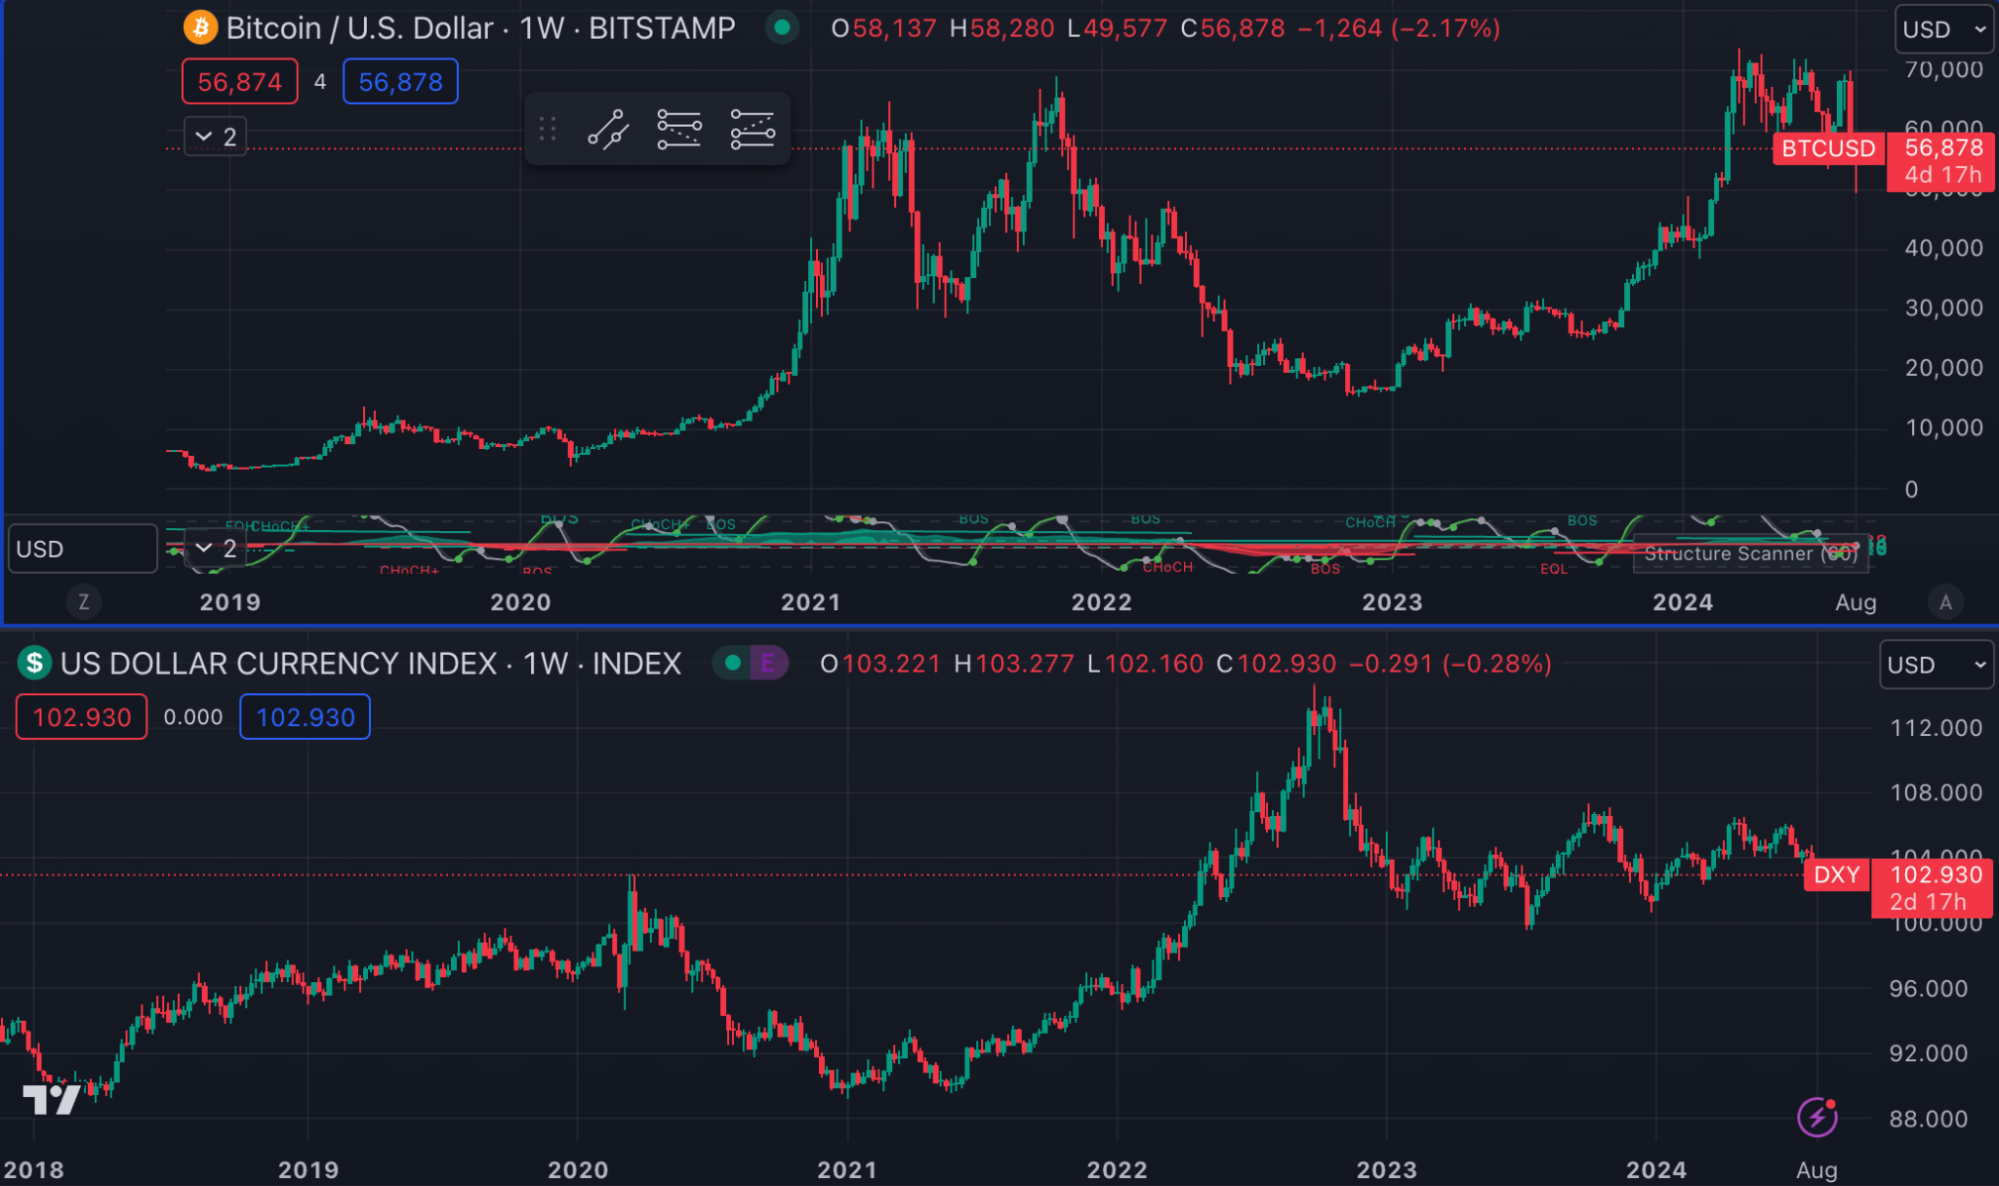
7. USD Strength (Dollar Index DXY)
What is it? The DXY measures the value of the US dollar against other major currencies.
Impact on Crypto? A strong USD can make USD-denominated investments more expensive and less attractive, potentially drawing funds away from crypto. Conversely, a weaker USD can boost crypto investments as investors seek alternatives.
Combining All Macro Indicators in One Place
Tracking these macro indicators individually can be cumbersome. Which is why tools like the TradingView Economic Calendar are especially useful, by consolidating all macroeconomic data in one place.
The tool provides real-time updates and historical data, helping you stay informed about economic trends and to help you make better trading decisions – in and out of crypto.
Key Takeaways
Understanding macroeconomic indicators is crucial for navigating the crypto market. By paying attention to these indicators, you can anticipate economic shifts and capitalise on opportunities.
As George Soros famously said, “It’s not whether you’re right or wrong that’s important, but how much money you make when you’re right and how much you lose when you’re wrong.” Stay informed, stay prepared, and trade smarter.
On-chain Indicators
Unlike traditional asset classes, crypto transactions on public blockchains are freely accessible – which makes them ideal for data science and machine learning.
Enter on-chain analysis, a gateway to leverage this rich, open-source financial data to provide traders with valuable insights into market trends, investor sentiment, and the behaviour of other market participants.
TL;DR
- On-chain analysis leverages blockchain data to provide insights into market trends, investor sentiment, and behavior.
- On-chain data is transparent and accessible, making it ideal for identifying emerging market trends and substantial transactions.
- Key metrics like active addresses, transaction volume, and supply distribution are crucial for understanding network health and market conditions.
- Tools like Glassnode, Dune Analytics, and Nansen offer comprehensive on-chain analytics to enhance trading strategies.
- On-chain analysis should complement other forms of analysis for more informed and cautious decision-making.
On-chain data refers to transactions that have been verified and are recorded on a blockchain. This data is openly accessible through block explorers like Etherscan and Solscan, providing a transparent view of blockchain activities. Needless to say, such resources can be key to identifying emerging market trends, substantial transactions, and more.
On-Chain vs. Off-Chain
On-chain transactions are verified and recorded on the blockchain by miners or stakers. They are transparent and accessible to anyone.
Off-chain transactions occur outside the blockchain, often on Layer 2 solutions, offering faster speeds and lower costs.
Comparison of Trading Analytical Methods
|
Fundamental Analysis |
Technical Analysis |
On-Chain Analysis |
|
|
Focus |
Market cap, trading volume, utility, and team authenticity to determine an asset’s value. |
Past data to predict future market movements. |
Blockchain-verified data to detect investment opportunities. |
|
Example |
Bitcoin’s scarcity (only 21 million in supply) drives its value. |
Patterns like head and shoulders can indicate potential price reversals. |
High inflows of Bitcoin to centralized exchanges might indicate selling pressure. |
|
Data Source |
Whitepapers, financial statements, market reports, news articles. |
Historical price data, trading volume, chart patterns. |
Blockchain explorers, on-chain analytics platforms (Glassnode, Dune Analytics, Nansen). |
Key Metrics in On-Chain Analysis
Active Addresses
Tracking the number of active addresses helps gauge user engagement and adoption. A rising number of active addresses usually indicates growing interest in the network.
Transaction Volume
This metric measures the total number of transactions over a period. High transaction volumes during volatile market periods can reveal user behaviour trends.
Supply Distribution
Supply distribution shows how a cryptocurrency’s total supply is divided among holders. A more decentralised supply indicates a healthier network.
Total Value Locked (TVL)
TVL measures the total value of assets locked in smart contracts on a blockchain. It reflects the adoption and usage of decentralised applications (dApps). A project’s token should typically correlate with a rising TVL, as it indicates activity and value.
On-Chain Indicators for Market Action
Realised Profits and Losses (RPL)
RPL tracks the gains or losses realised when an asset is sold. A high RPL might indicate selling pressure, while a low RPL can suggest bullish sentiment and potential buying opportunities.
Supply in Profit or Loss
This metric shows the number of coins in profit or loss based on their last moved price. It helps identify potential support and resistance levels in the market.
Realised Capitalisation
Unlike market cap, realised capitalisation values each coin based on its price when last moved, providing a more accurate reflection of the network’s value.
What Are the Top Tools for On-Chain Analysis?
Glassnode
Glassnode offers extensive on-chain indicators and market insights for over 900 assets. It features customisable dashboards, integration with apps like TradingView, and in-depth reports.
Dune Analytics
Dune Analytics allows users to query and visualise blockchain data through SQL queries. It provides a wide range of metrics and visualised charts for easier analysis.
Nansen
Nansen combines blockchain data with labelled wallets to offer comprehensive on-chain analytics. It features customisable smart alerts, real-time data, and in-depth dashboards.
Key Takeaways
On-chain analysis has proven to offer valuable insights that can enhance any market participant’s investment or trading strategies. Leveraging analytics tools like Glassnode, Dune, or Nansen is a great way to make more informed decisions based on real-time blockchain data.
However, as always, relying solely on one tool or indicator is often insufficient – such analytics tools should complement (not replace) other forms of analysis. Use the insights to guide your decisions, but always exercise caution and DYOR.
Theoreticals aside, if you wish to begin trading crypto derivatives or spot on BitMEX, you can find all our existing products here. For more educational resources on trading at BitMEX, particularly derivatives, visit this page.
To be the first to know about our new listings, product launches, giveaways and more, we invite you to join one of our online communities and connect with other traders. For the absolute latest, you can also follow us on Twitter, or read our blog and site announcements.
Related
The post appeared first on Blog BitMex


