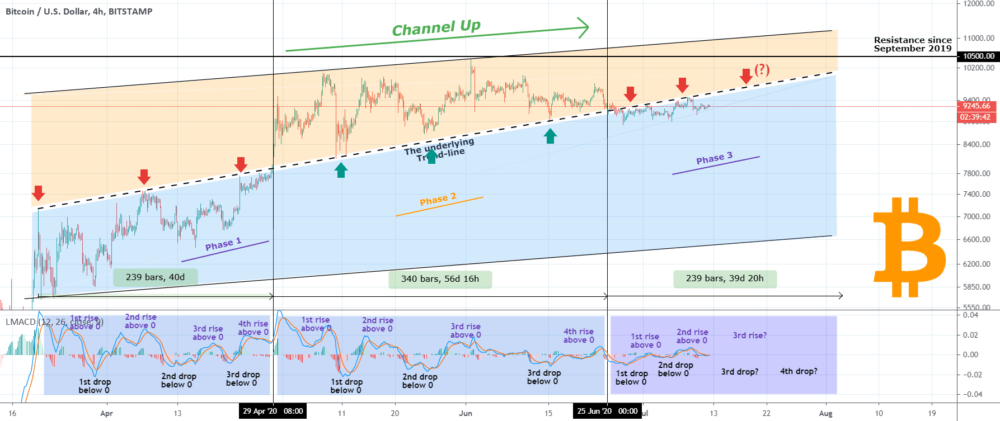
Characterized by an explosive rally in the last 24 hours, bitcoin just took back this year’s high again. But a popular TradingView-based analyst is calling for BTC to hit $14,300. This is based on the ‘Underlying Trend-line’ analysis, which, according to him, is the “the most consistent trend-line since March.”
Bitcoin Testing The Underlying Trendline Again, Next Stop $14,300
As per TradingShot(TS), a widely popular bitcoin analyst, all the signs are pointing to BTC rallying to higher price points. How high? Well, the ‘Underlying Trend-line’ that TS published in June this year suggests a climb to the $14,300 mark.

TS says that bitcoin’s current underlying trendline has been the most consistent one since March. BTC is testing it again.TS reminded readers of the same and mentioned the culmination of the price action into strong rallies whenever there’s an ‘upward breach’ of the trendline.
The bitcoin price observer and chartist commented that similar to April, BTC is undergoing a heavy bout of accumulation.
As back in April, BTC has again formed a Channel Up on its 1D RSI , which represents accumulation on the actual price action. It is probably a matter of time before this breaks upwards.
Talking about the technical setup in detail, TS considers bitcoin’s price action within the above mentioned ‘Channel Up’ and one of its crucial aspects, the Fibonacci extension. Extrapolating the 3.000 Fibonacci extensions ‘from the 3rd high after the previous top’ gives us an idea about the next local top.
If the calculation works out this time as well, the bitcoin price may be heading towards $14,300.
Bloomberg’s Analysis Also Points To A $14,000 BTC by 2020 End.
As reported by CryptoPotato earlier during this month, Bloomberg’s senior commodity strategist Mike McGlone also suggested that bitcoin’s price could hit $100,000 by 2025. However, it is also important to note that Mike made a pretty resounding case for a $14,000 BTC by year-end.
While talking further about his Bitcoin price forecast this year, Mr.McGlone included the ’30-day average of Bitcoin active addresses from Coinmetrics’. He said that BTC’s active addresses were ‘a leading indicator of the recovery in 2019’.
Looking at the current trend of Bitcoin wallet addresses, he said that the trend points to a price point that is closer to the $15,000 mark than $10,500 (as of October 2).
Unless these gauges reverse, it’s unlikely the price will decline. – The BI commodity strategist said.
Crypto Exchange Kraken Had Predicted The Same Earlier In September
Citing its August 2020 Bitcoin Volatility Report, cryptocurrency exchange Kraken had pointed out that according to past trends, September always has been a lackadaisical month for bitcoin. But from October onwards, BTC will be in for an ‘incremental volatility’ ride and a price movement to the upside.
The exchange considered bitcoin’s historical 94-day year-end trend. As per the calculations, Kraken said bitcoin has almost 2 months to register fresh gains for investors and surpass the 315-day volatility moving average.
A look at the last nine years of data confirms the occurrence of a rally into the year-end and ‘incremental volatility’. – The exchange said.
Binance Futures 50 USDT FREE Voucher: Use this link to register & get 10% off fees and 50 USDT when trading 500 USDT (limited offer).
The post appeared first on CryptoPotato


