- TRON flashes mid-term bullish following the recent increase in Bitcoin’s price.
- TRX price could surge in the coming days due to the latest increase in buying volume.
TRX/USD: Tron Eyes $0.015 Resistance
Key Resistance Levels: $0.014, $0.015
Key Support Levels: $0.012, $0.0106

The latest increase in Bitcoin’s price and volume has led to significant growth in the entire crypto market cap – $197.5 billion, now closing $200 billion by the day.
As a result of this, the price of TRON went up by 9.40% over the past hours; and it’s currently trading around $0.013 against the US Dollar.
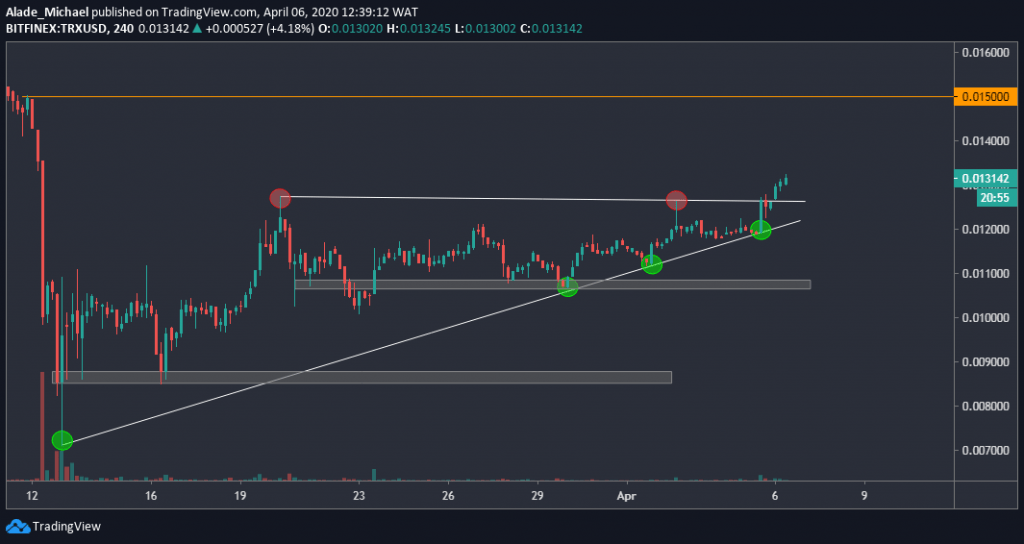
This growth comes as a major recovery from the green circled areas (0.0073, $0.0106, $0.011, and $0.0185), as shown on the 4-hours chart.
More so, TRX broke out from an ascending triangle earlier today after suspending bullish actions for over three weeks. From what can be seen now, the bulls appeared to have won the battle in the short-term.
Tron Price Analysis
After breaking out from $0.0125, circled red on the price chart, Tron is now facing $0.014 level on the upside. Although the major price targets here is $0.015 resistance, marked orange in the above chart.
TRX is currently supported by $0.012 over the last 24-hours. In case of a pullback, it is likely to bounce at $0.0125, which is right on the triangle.
If it fails and price slumps below the $0.012 support, TRX could dump into the first grey demand area at $0.0106 before dropping further to the second. Considering the increasing TRX buying volume, the price is more likely to increase in the coming days.
TRXBTC: TRX Pulling Back After Triangle Breakout
Key Resistance Levels: 1930 SAT, 204 SAT, 215 SAT
Key Support Levels: 174 SAT, 169 SAT, 160 SAT

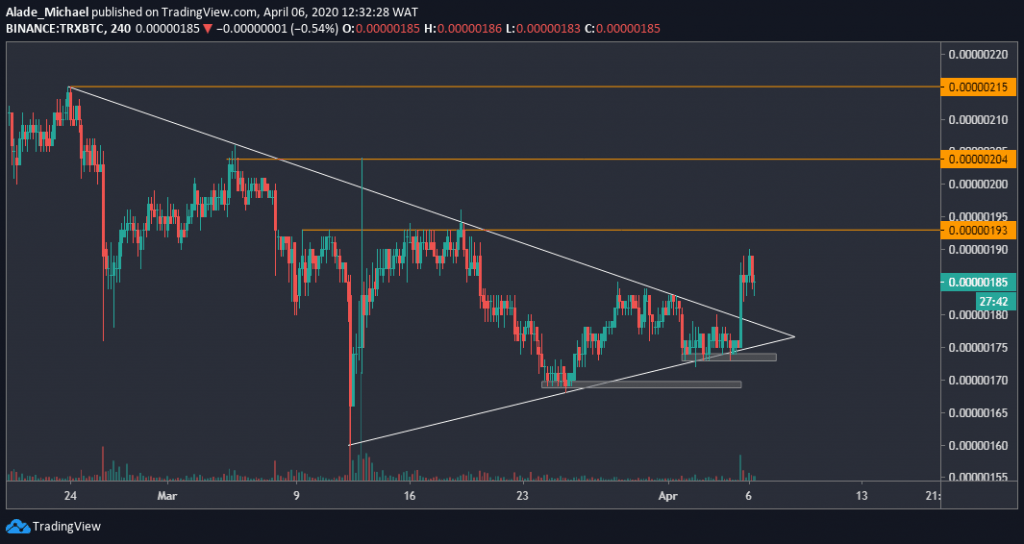
Against Bitcoin, TRON is beginning to flash bullish after moving out from a mid-short-term symmetrical triangle pattern yesterday. The breakout was led by a 6% surge to reach 190 SAT.
But now, the price has dropped to 185 SAT level following a slight pullback. Though, TRX is expected to bounce back as soon as it finds nearby support.
A look at the current market structure suggests that a fresh mid-term bullish is about to start for the TRX/BTC pair, especially with the latest increase in the volatility and volumes.
The only condition for a bearish continuation here is if the price slips back beneath the previous lows of 174 SAT and 169 SAT areas, marked grey on the price chart. As of now, the price is rising, which suggests a bullish case for TRX at the moment.
Tron Price Analysis
After a sharp triangle breakout, TRON made a nice pullback (providing a good buying discount) at around 182 SAT. An exhaustion point is likely found at 180 SAT.
From here, the next rally would target 193 SAT resistance, followed by 204 SAT and 215 SAT, marked orange on the chart.
If TRX fails to refuel at 180 SAT, a further sell could drop the price back to 174 SAT (monthly low), and 169 SAT support, right in the grey spots. The last defense line for the bulls is 160 SAT – the March 12 crash level.
The post Tron Price Analysis: TRX Flashes Bullish At $0.013 Following Bitcoin’s Increase, Is $0.014 Next? appeared first on CryptoPotato.
The post appeared first on CryptoPotato


