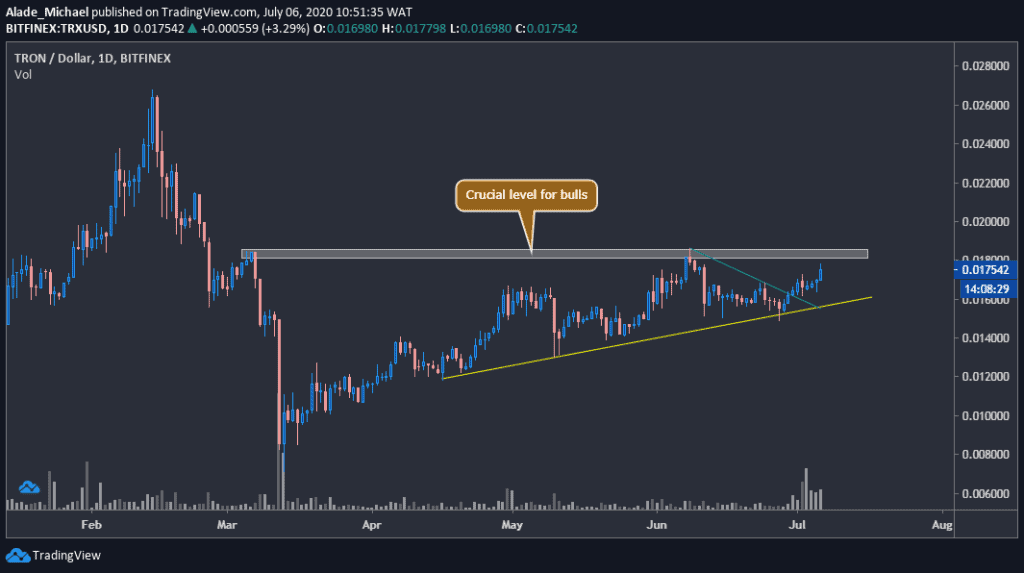
- The price jumped to $0.0178, following a 6% growth over the last 24-hours.
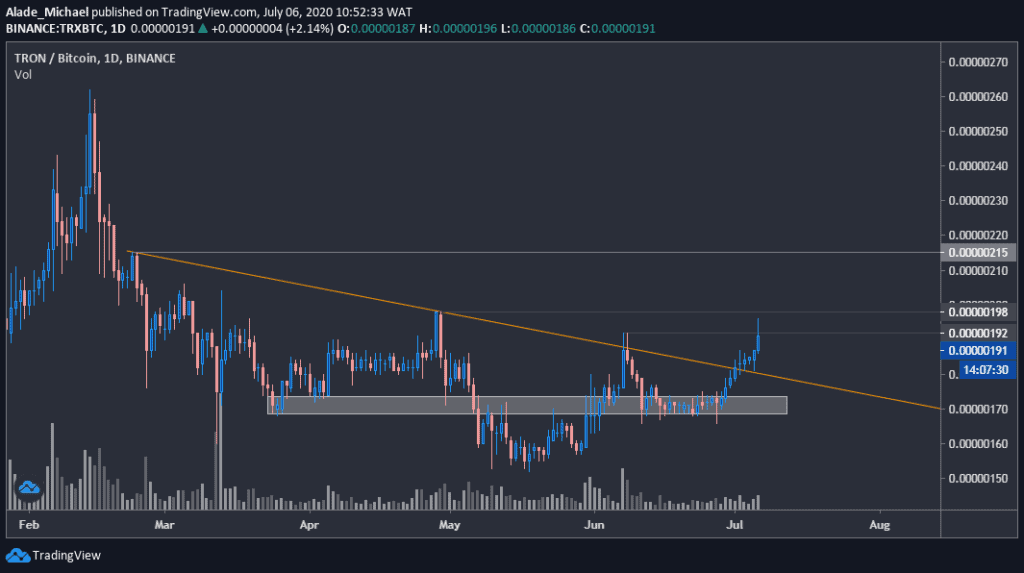
- Against Bitcoin, TRX broke out and slowly gained momentum after staying bearish for five months.
TRX/USD: Tron Charges Back At March’s Resistance
Key Resistance Levels: $0.0186, $0.0215, $0.023
Key Support Levels: $0.0168, $0.0149, $0.014

After establishing a three-weeks low around $0.015, Tron bounced back and started to show signs of strength again. The increase became noticeable as it breached a very important resistance level
This recovery was later followed by a push above $0.0168 and $0.0173 resistance levels to where it is now priced at $0.0178 against the US Dollar. The price is now approaching another crucial area at $0.0186 – the March resistance – which could send TRX quickly to $0.0268 if a breakout happens.
But a continuous rejection at this crucial resistance could suspend bullish actions for a while. A bearish scenario might come into play if the price falls beneath the yellow ascending trend line back to $0.0149. A double-top pattern would confirm if the price dips further.
Tron Price Analysis
Tron’s price almost touched $0.0179 today after seeing 8% growth over the past hours, although the significant bullish target lies at $0.0186 – the grey area in the above daily chart. A break at this level would initiate a new increase to $0.0215 and $0.023 resistance levels before advancing higher.
There’s close support at $0.0168 in case of a drop. Should the price drop below the current base support at $0.0149 to confirm a double-top pattern, the next critical support may come somewhere around $0.012, but it may encounter the $0.014 level along the way.
The latest increase in volume indicates that buyers are stepping back into the market – it could last long if the price recovers well above the March’s resistance.
TRXBTC: Tron Moving Out From Mid-Term Bearishness
Key Resistance Levels: 198 SAT, 215 SAT
Key Support Levels: 170 SAT, 150 SAT

Following the recent 2% growth in Bitcoin’s price, Tron increased by 6% to reach 196 SAT today, but the price has dropped slightly back to 191 SAT at the moment. It seems to be gaining momentum, looking at the last 48-hours push from a key level at 170 SAT. Meanwhile, it has formed base support at the 150 SAT level.
The interesting thing here for the bulls is the recent increase above the orange resistance line, which is becoming more significant by the day, coupled with an increasing buying volume – currently low. However, the breakout still looks shaky for a bullish reversal.
Tron Price Analysis
The bullish reverse pattern is taking shape on the daily chart with a slow momentum. Meanwhile, TRX still needs to clear the mentioned key resistance levels before looking at the 215 SAT resistance. The major short-term target lies at 240 SAT and 260 SAT levels.
If the price pulls back now, it may find a rebound on the orange resistance-turned-support line. A drop below this line may slip the price back inside the grey demand area of 170 SAT, followed by the current yearly low at 150 SAT level.
Click here to start trading on BitMEX and receive 10% discount on fees for 6 months.
Disclaimer: Information found on CryptoPotato is those of writers quoted. It does not represent the opinions of CryptoPotato on whether to buy, sell, or hold any investments. You are advised to conduct your own research before making any investment decisions. Use provided information at your own risk. See Disclaimer for more information.
The post appeared first on CryptoPotato


