Bitcoin’s rally to $16,000 has fallen short, however, it was enjoyable nonetheless. The market’s altcoins, in particular, suffered during this brief rally, before going on the road to recovery again. This brings us to the next question(s)- What of Bitcoin? Is the top in?
Well, it is simple. We will see either of the two scenarios manifest in the upcoming future,
- Bitcoin surges higher, breaking through resistances
- Bitcoin pulls back to accumulate and then, surges higher
To contrarians wondering if Bitcoin will crash, well, it won’t.
The first scenario is unlikely, especially considering Bitcoin’s recent journey and how it rose by 40% in just 20 days. So, by default, the second scenario is the one that could happen soon, and this would mean that the local top is in.
Here are 3 reasons why this is the local top.
Depth Chart


Source: Bybt
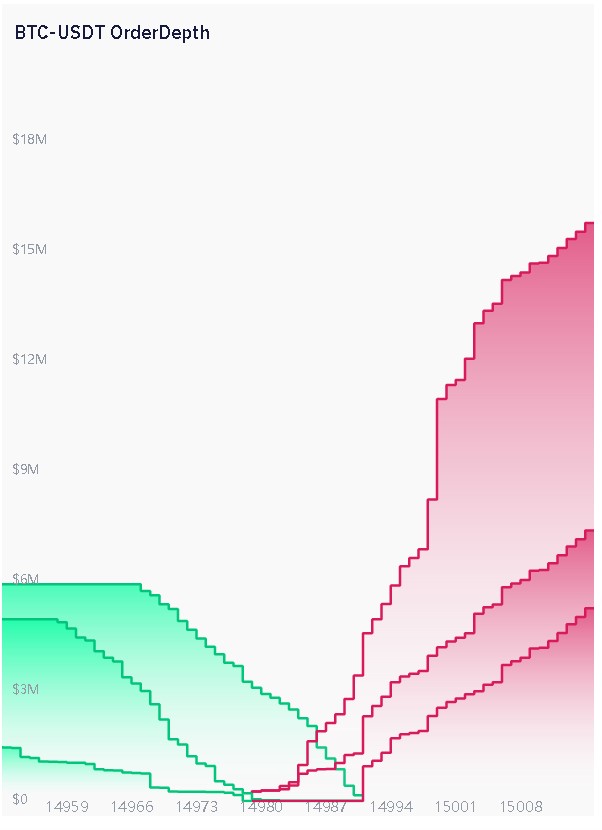
According to the chart attached herein, at least for the time being, there is massive selling pressure. We can also see a huge buy-wall [of $6 million] for Bitcoin at $14,970. However, a steep sell-wall [of $9 million] is also visible at the same level.
Additionally, the sell-wall goes up to $12 million for BTCUSDT.
Funding Rate


Source: Bybt
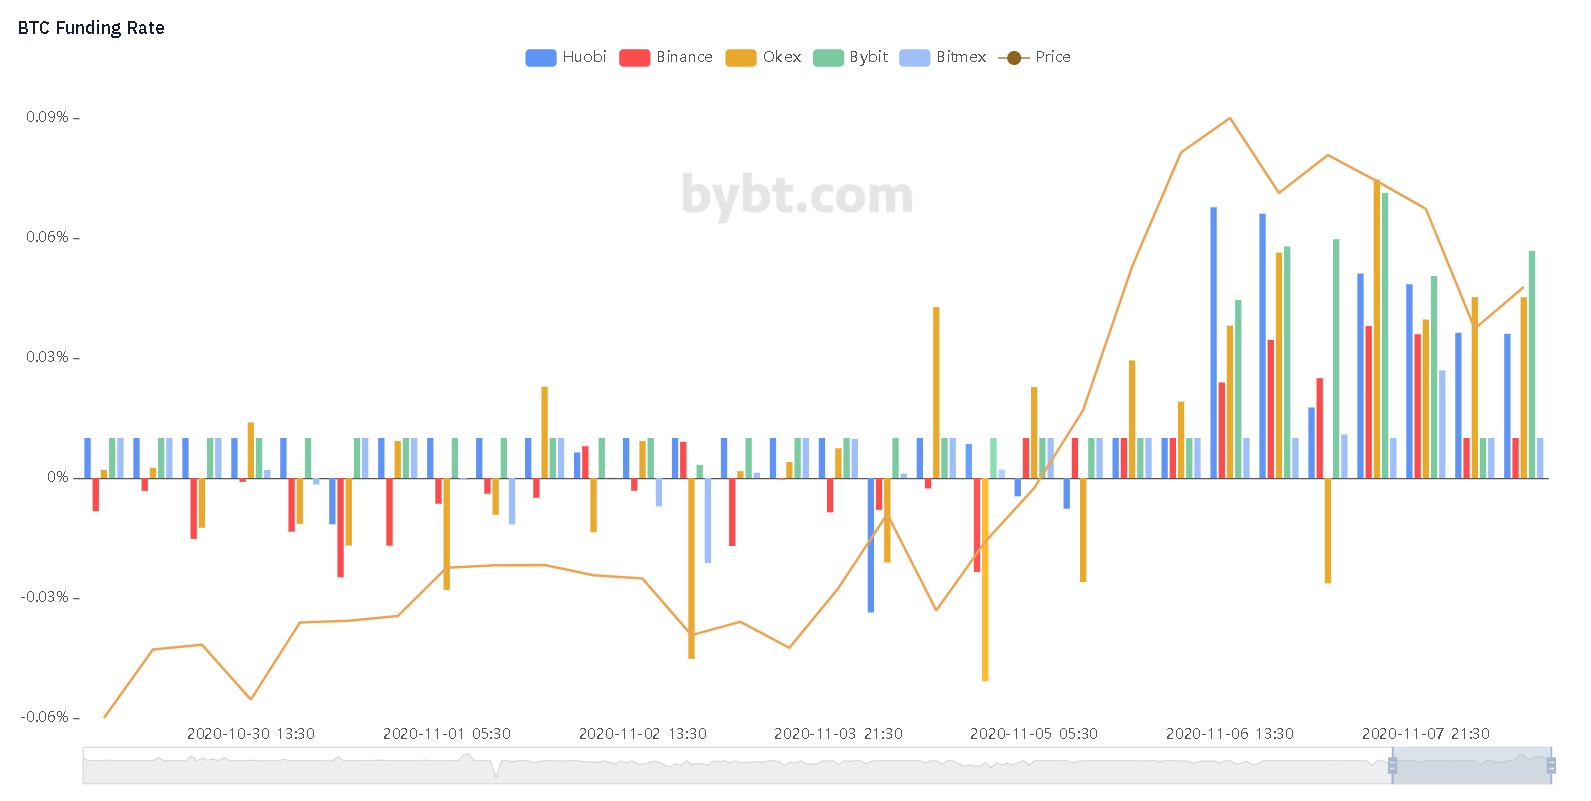
The funding rate shows the number of shorts v. longs in an exchange. If the funding rate is positive, it means a lot of users are buying the asset and hence, these users will pay the users who are shorting. The opposite is true for a negative funding rate since here, the shorts pay the longs.
From the chart, it can be observed that the “long-euphoria” seemed to have run out on 6 November on most exchanges.
Although it remained positive at the time of writing, it was dipping, pointing to the exhaustion of the market’s bulls.
Trend


Source: BTCUSD TradingView
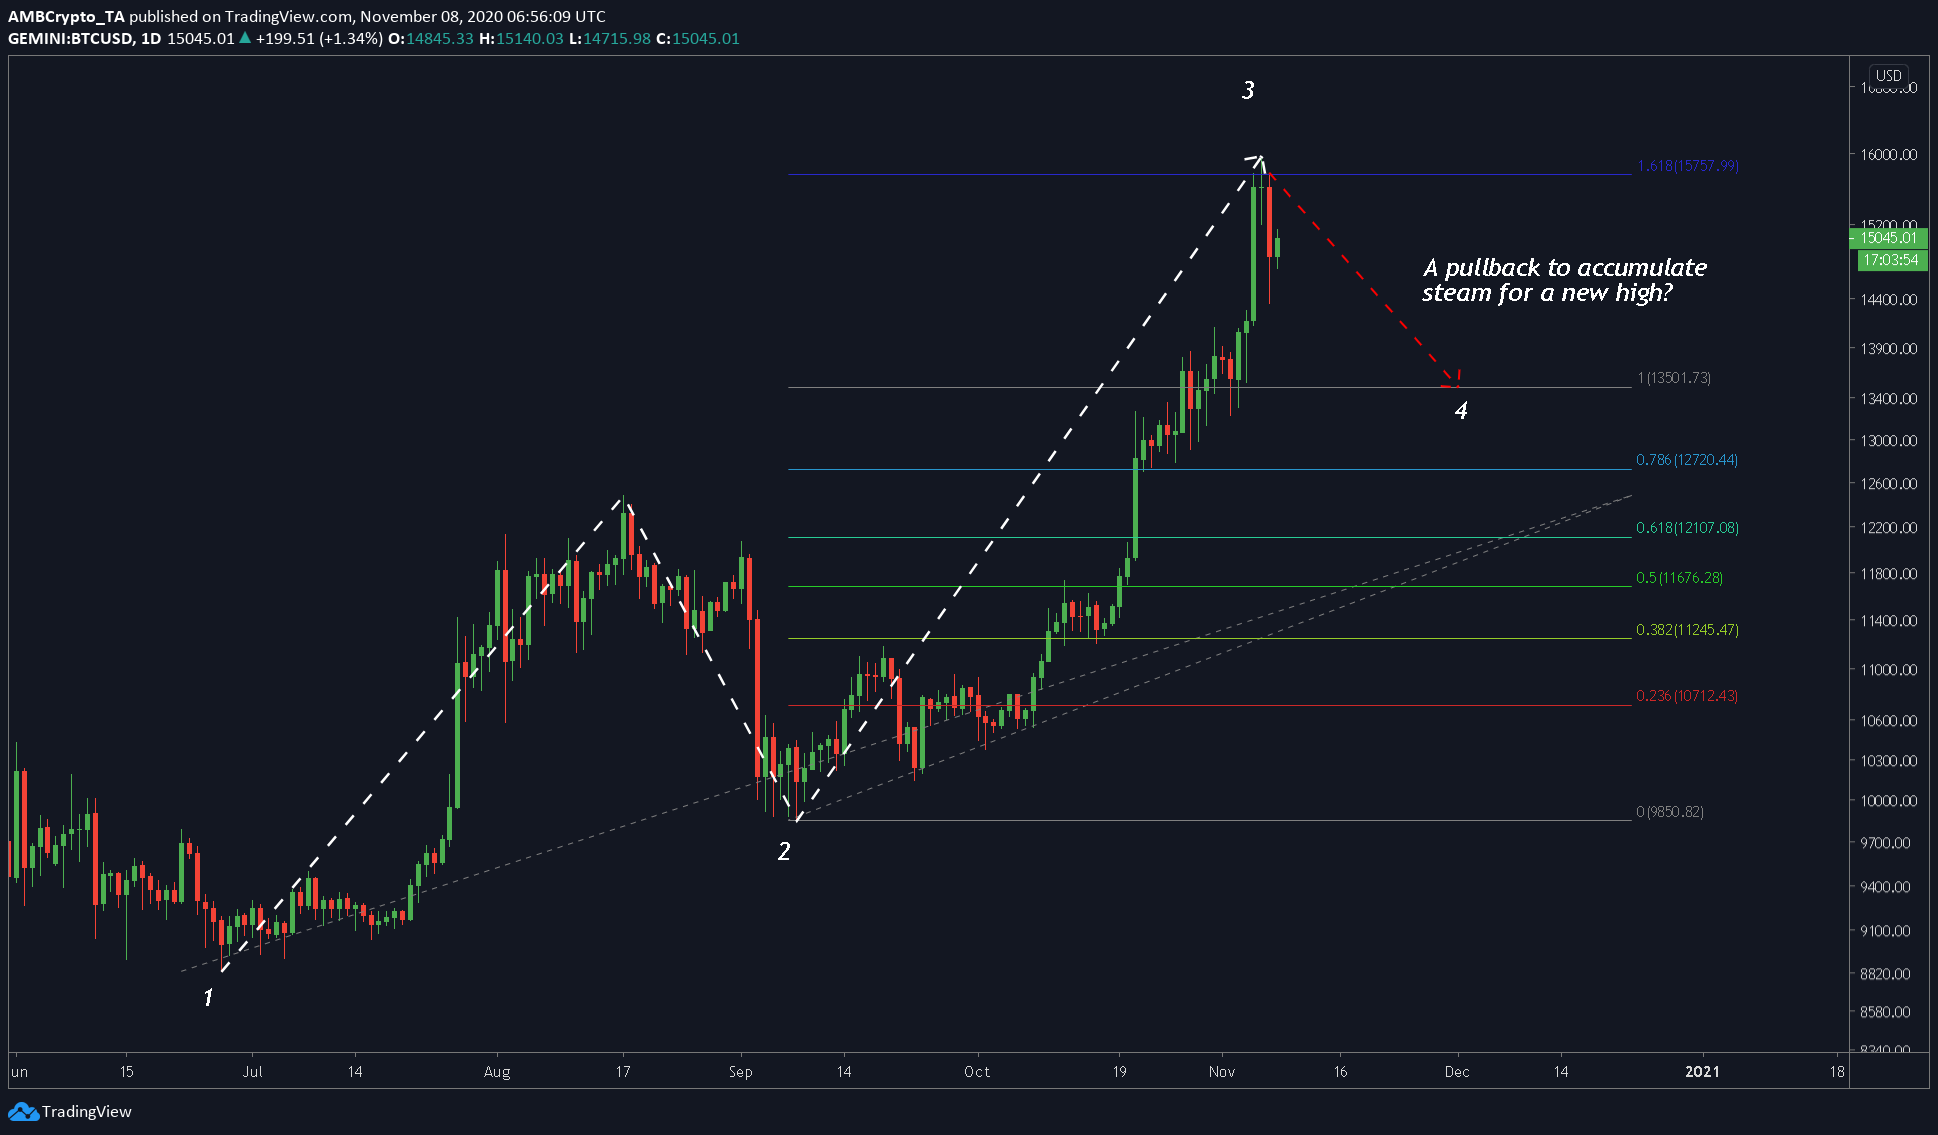
Finally, the trend chart showed that Bitcoin had successfully climbed to ~$16k, however, in doing so, it has noted one pullback so far. Using the Trend-based-Fibonacci tool, we can expect a drop down to the $13,000-level, one that is at the top of the previous impulse wave. In a much more dire situation, we can expect the pullback to head down to the 0.786-Fibonacci level at $12,780.
To conclude, all these metrics point that a drop is coming soon and that the local top is in.
The post appeared first on AMBCrypto


