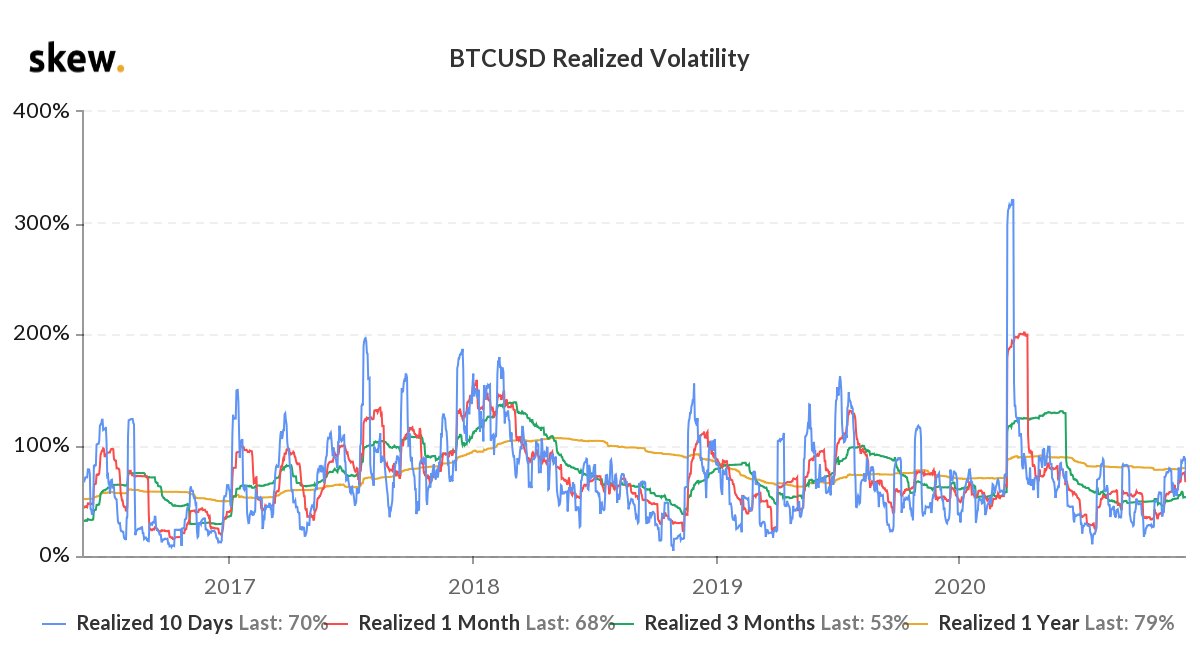
Traders who witnessed Bitcoin’s 80% drop in price following the 2017 Bull Run to ascent from $1000 to new ATH of $19891.99 on Coinbase in 2020 have seen it all. The rally of massive volatility, the quiet rally and the quietest ever rally. Despite the media attention, a certain degree of hype on social media, especially Crypto Twitter, and rapid institutionalization, Bitcoin’s price rallied without the anticipated usual burst of volatility.


BTCUSD Realized Volatility || Source: Skew
The spike in the volatility chart, in the first half of 2020 is the pre-halving volatility, and post that the volatility remained bounded below 100%. The spike hit higher than 300% in volatility (realized 10 days). Though there is enough institutional buying, at an aggressive pace, volatility is relatively low. This points to two inferences: either the bull run hasn’t even started or the bull run is over, without volatility crossing 100%. Willy Woo, a popular on-chain analyst’s Bitcoin Network Momentum chart has recorded previous Bitcoin bull runs as bull runs due to high momentum; however, the same cannot be said for the current bull run.


Bitcoin Network Momentum || Source: Woobull Charts
Network Momentum suggests the possibility that the bull run may not even have started yet. If this is the case, then the market cycle may skip a phase this time around, instead of a drop in price and the bull run may begin when the price crosses resistance at $20000. The current institutionalization may just be the groundwork of a long and sustained price rally. Or as on-chain analysts have been suspecting, there may be a correction before price discovery above $20000.
The second possibility, that the bull run is over seems less likely as the top driver of Bitcoin’s price is its shortage. Despite increased liquidity from the selling pressure on Whales, institutional buying has managed to keep percent active supply at its lowest in 2 years based on data from Glassnode. Exploring these top two probabilities, the first one seems likely given the current price level, below $19000, and the trade volume on spot exchanges. With the highest number of shorts on Bitcoin at $20000 on most derivatives exchanges, sustaining the $19000 level this week was a challenge. At the time of writing Bitcoin’s price was $18800 based on data from coinmarketcap.com.
The post appeared first on AMBCrypto


