Two years ago, as Bitcoin inched closed to the $20,000 valuation, several altcoins joined the rally. None more so than XRP, the premier payments-centric cryptocurrency enjoyed a massive high in late-2017, and relatively held back its losses in the crypto-winter of 2018.
In 2019, the markets have not been too kind to this digital currency. With a press-time price of $0.22, down 90 percent from its ATH, and over 32 percent since the beginning of the year, the third-largest cryptocurrency on the market is having a woeful time. However, XRP could begin 2020 off on a high.
Familiar Move

Source: XRP/USD on TradingView
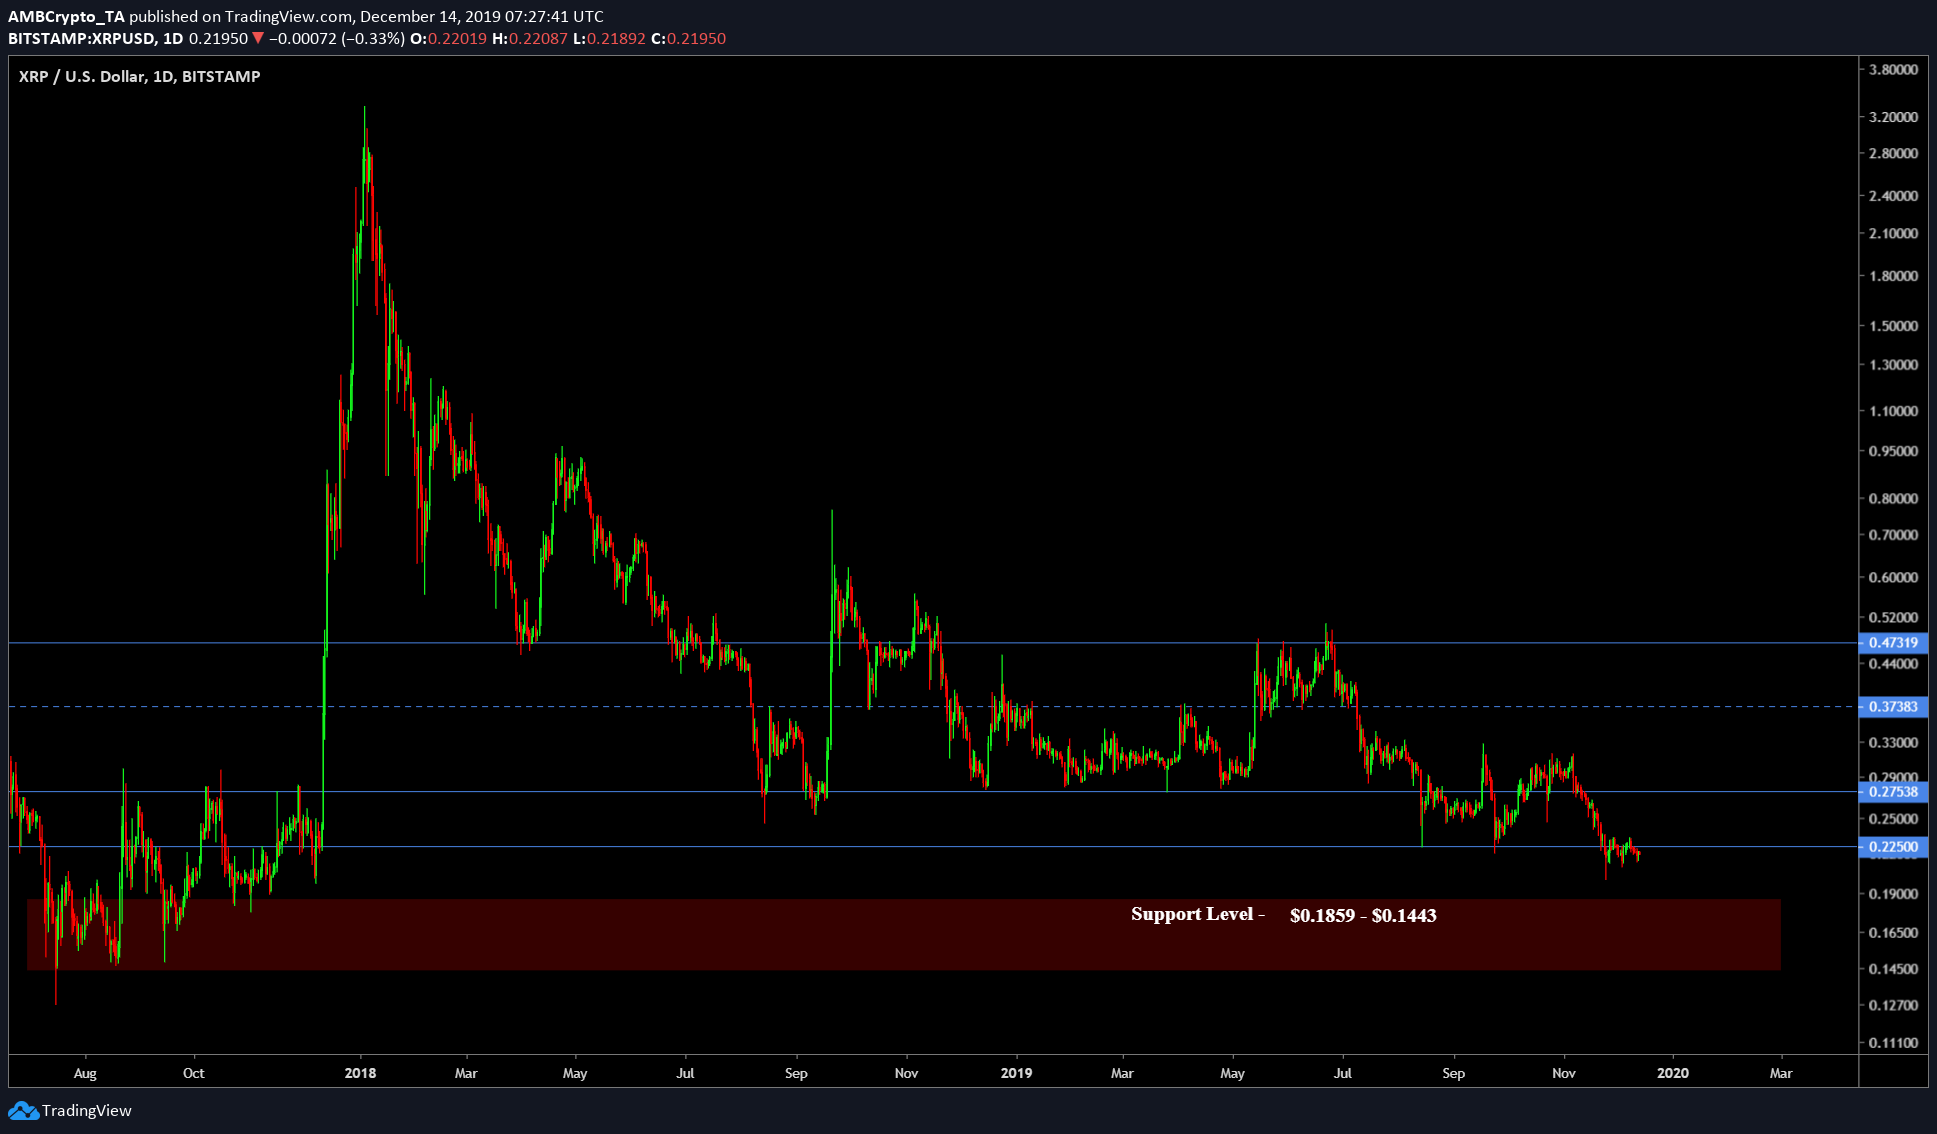
Since reaching its ATH at the beginning of 2018, XRP has been in a slump, much like the rest of the market, producing interesting patterns. On three occasions, in the 22 months since reaching the price of $3.4, the cryptocurrency has seen three falling wedges, each punctuated by a rise.
In May 2018, XRP dropped from $0.75 to well below $0.275, almost the base from which it shot up in six months. This was the first rebound, from a key support-level, one which most major cryptocurrencies have bounced-off in the previous year. A massive surge was seen in October 2018, prior to Bitcoin hitting its rock-bottom 2018 price as XRP neared $0.6 breaking three-key levels in the process – $0.275, $0.373 and $0.473.
The two other wedges were seen in 2019. First as XRP bounced-off, after reaching $0.275 in May and the second when it dropped to $0.225 in September. While the increase following the coin’s move out of the wedge was muted, compared to previous rebounds, it did cause an uptick of over 30 percent from September to November. Since then, the price has been entrenched in yet another wedge pushing the price below $0.225.
Danger Zone

Source: XRP/USD on TradingView
With XRP trading below the $0.225 level, there could be two moves on the horizon. If the wedge-pattern continues and XRP breaks out of it, as it has for the previous year and a half, the price could rebound up. Bullish movements should then be looked at with the following price-points kept in mind – $0.275 – not crossed since mid-November, $0.373 – not crossed since early-July, and 0.773 – briefly visited in June 2019, but last major move above in November 2018.
A move down could amplify its woes, yet again. XRP is already at its bottom for 2019, and a move lower could spell doom for the coin. Specifically a move below the broad-support level of $0.189 – $0.144. This level, as mentioned in the chart above, follows from the 2017-base and forms an important sentimental level for the market. If XRP slips by more than 14 percent, planting it within the said level, the price could slump further.
The post appeared first on AMBCrypto


