Following the sudden rise in XRP’s value from the $0.184 mark to $0.225 in just three days, beginning from 3 January, the coin has been making steady gains, rising all the way up to $0.25. However, XRP seems to be following a fractal and could be in for a drop in the short-term. At the time of writing, it had a market capitalization of nearly $10.2 billion, with over $2.4 billion worth of XRP traded over the last 24 hours, according to CoinMarketCap.
XRP 4-hour chart

Source: XRP/USD on TradingView
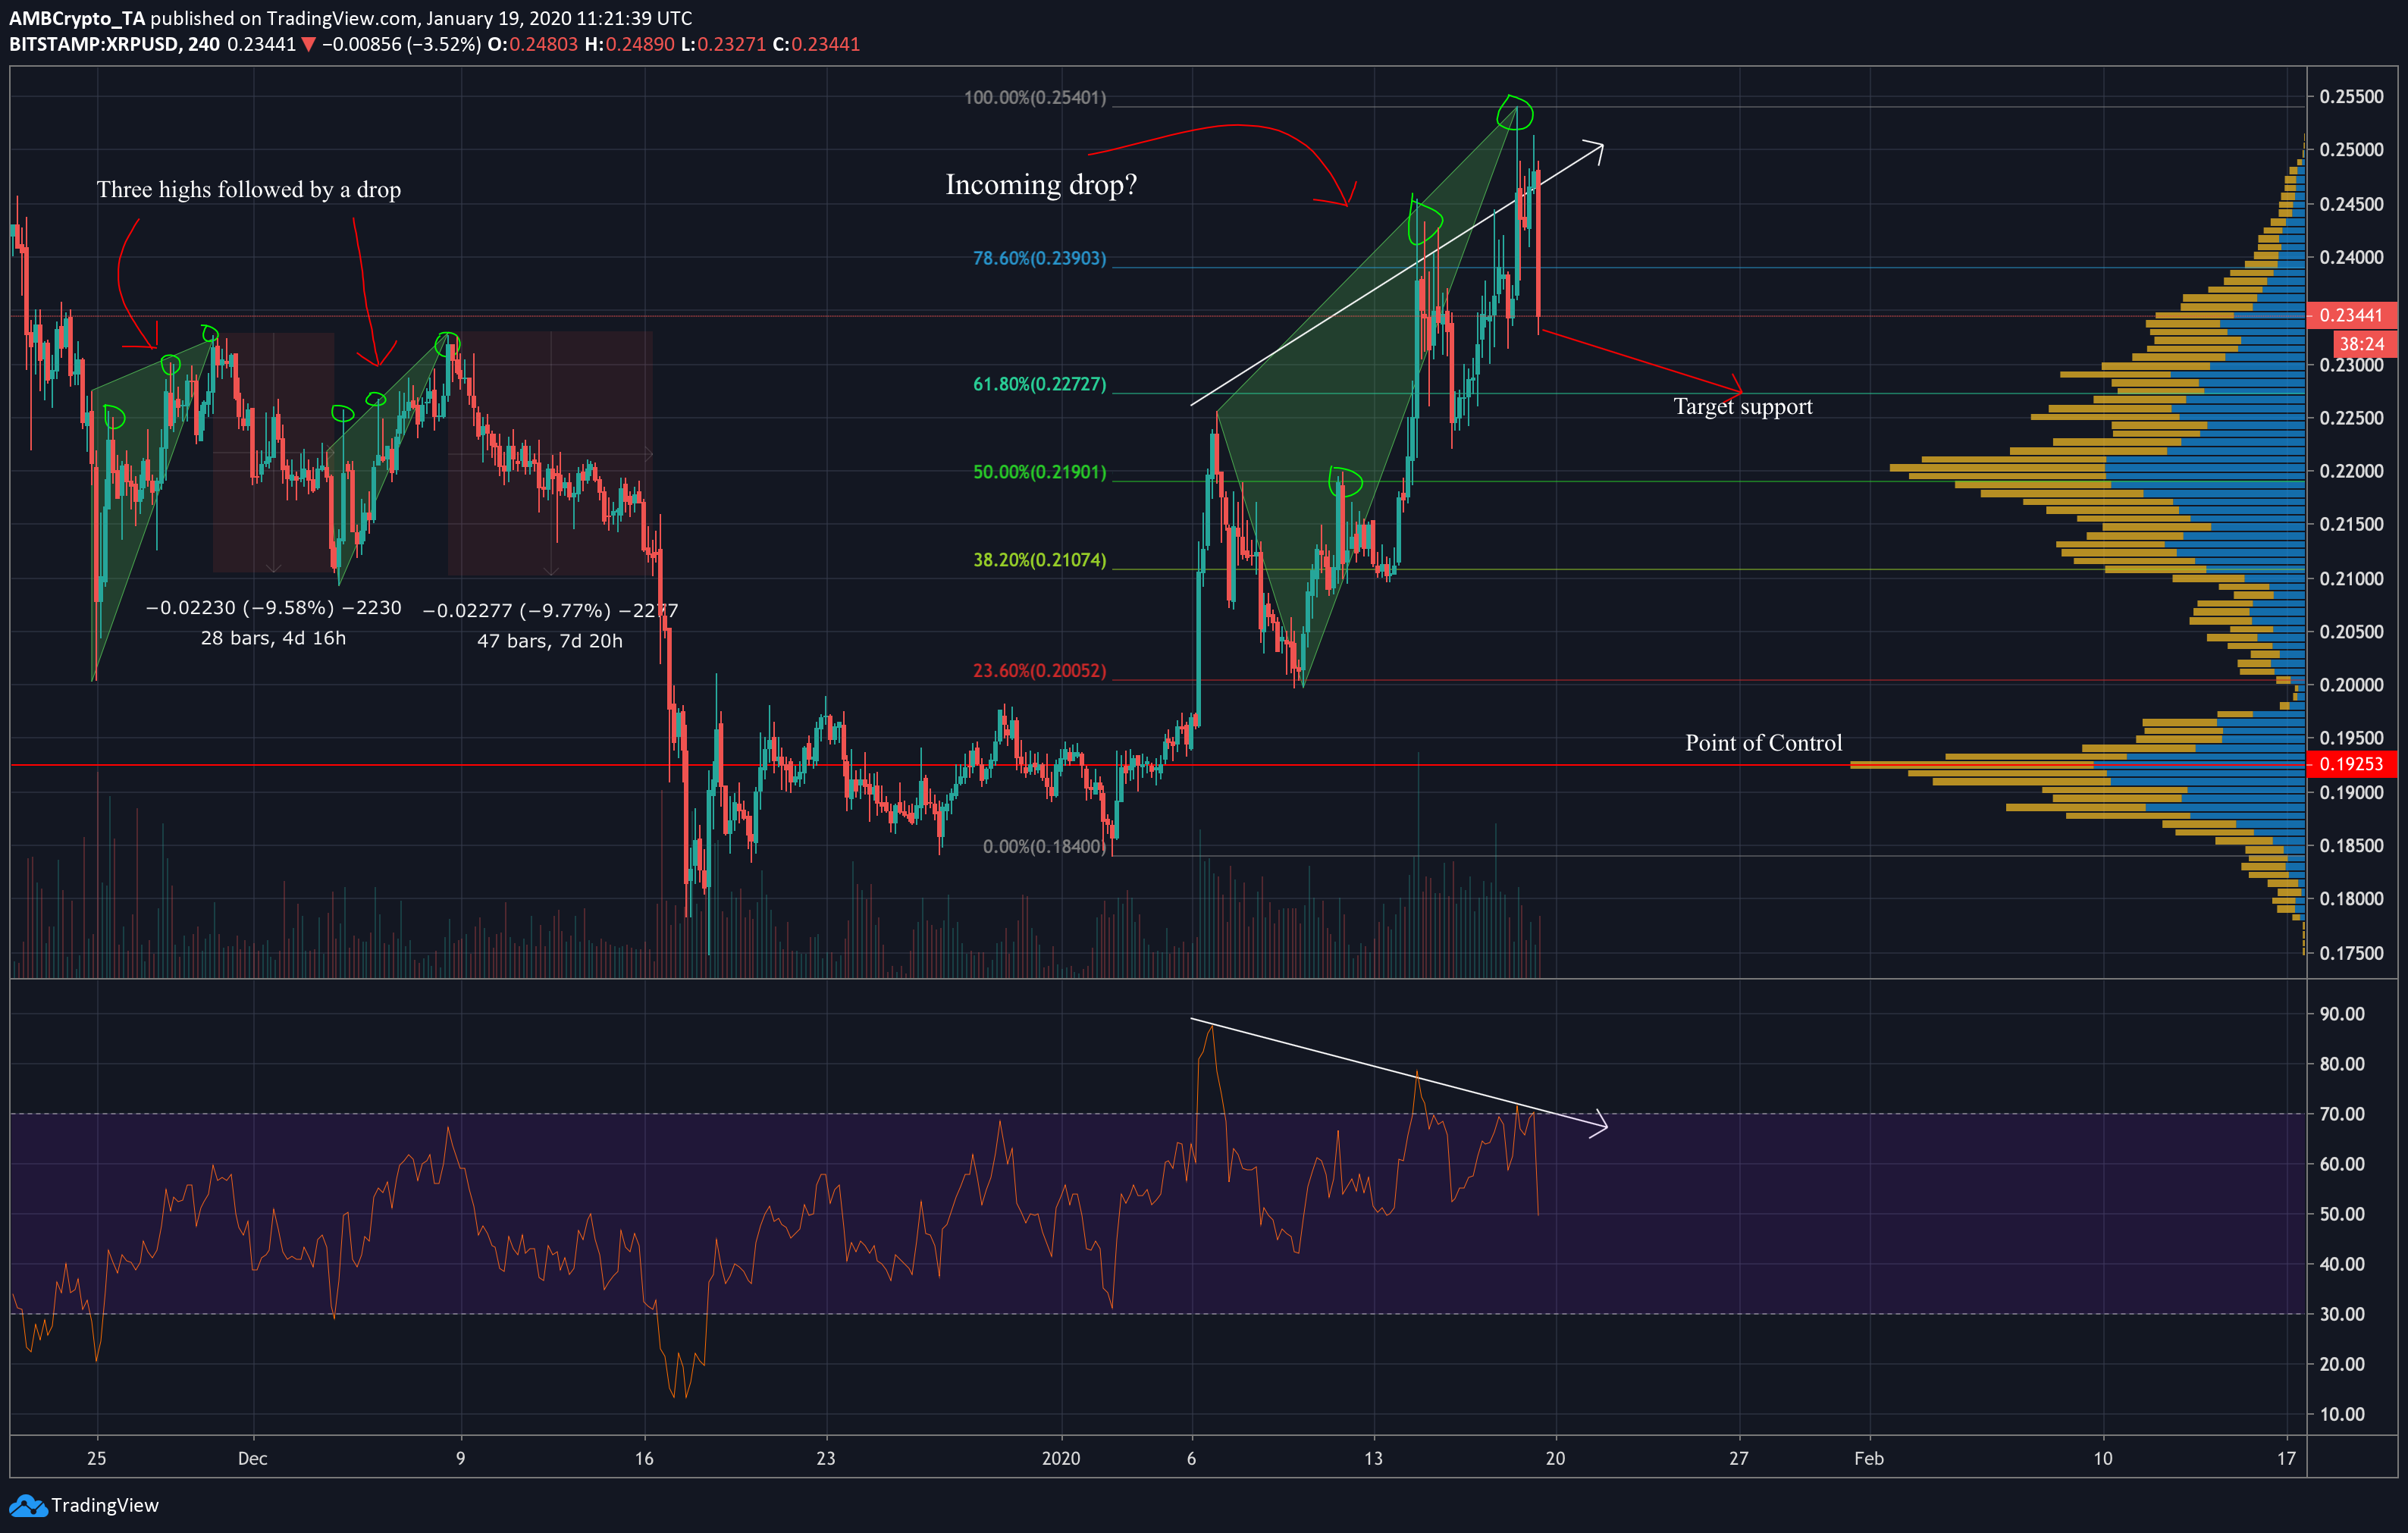
In late-November last year, XRP dropped from $0.227 to $0.20 in less than half a day, followed by three peaks over the next week or so. Following another ~9.6% drop over the next 4 days, it rose once more, forming three distinct peaks, which again, was followed by a ~9.8% drop over the next week. Following a dip in XRP’s value from $0.225 to $0.20 between 7th and 10th January, XRP began to rise again, forming three distinct peaks during the ascension.
If the price follows this fractal, XRP will fall in value over the coming week down to the 61.8% Fibonacci retracement line at $0.227. Also, the Relative Strength Index (RSI) indicator was seen to be making lower highs since 7 January, contrary to the increase in price since then. This is an indication of bearish divergence and supports the idea that XRP will move down in the near future.
Correlation with Bitcoin

Source: CoinMetrics
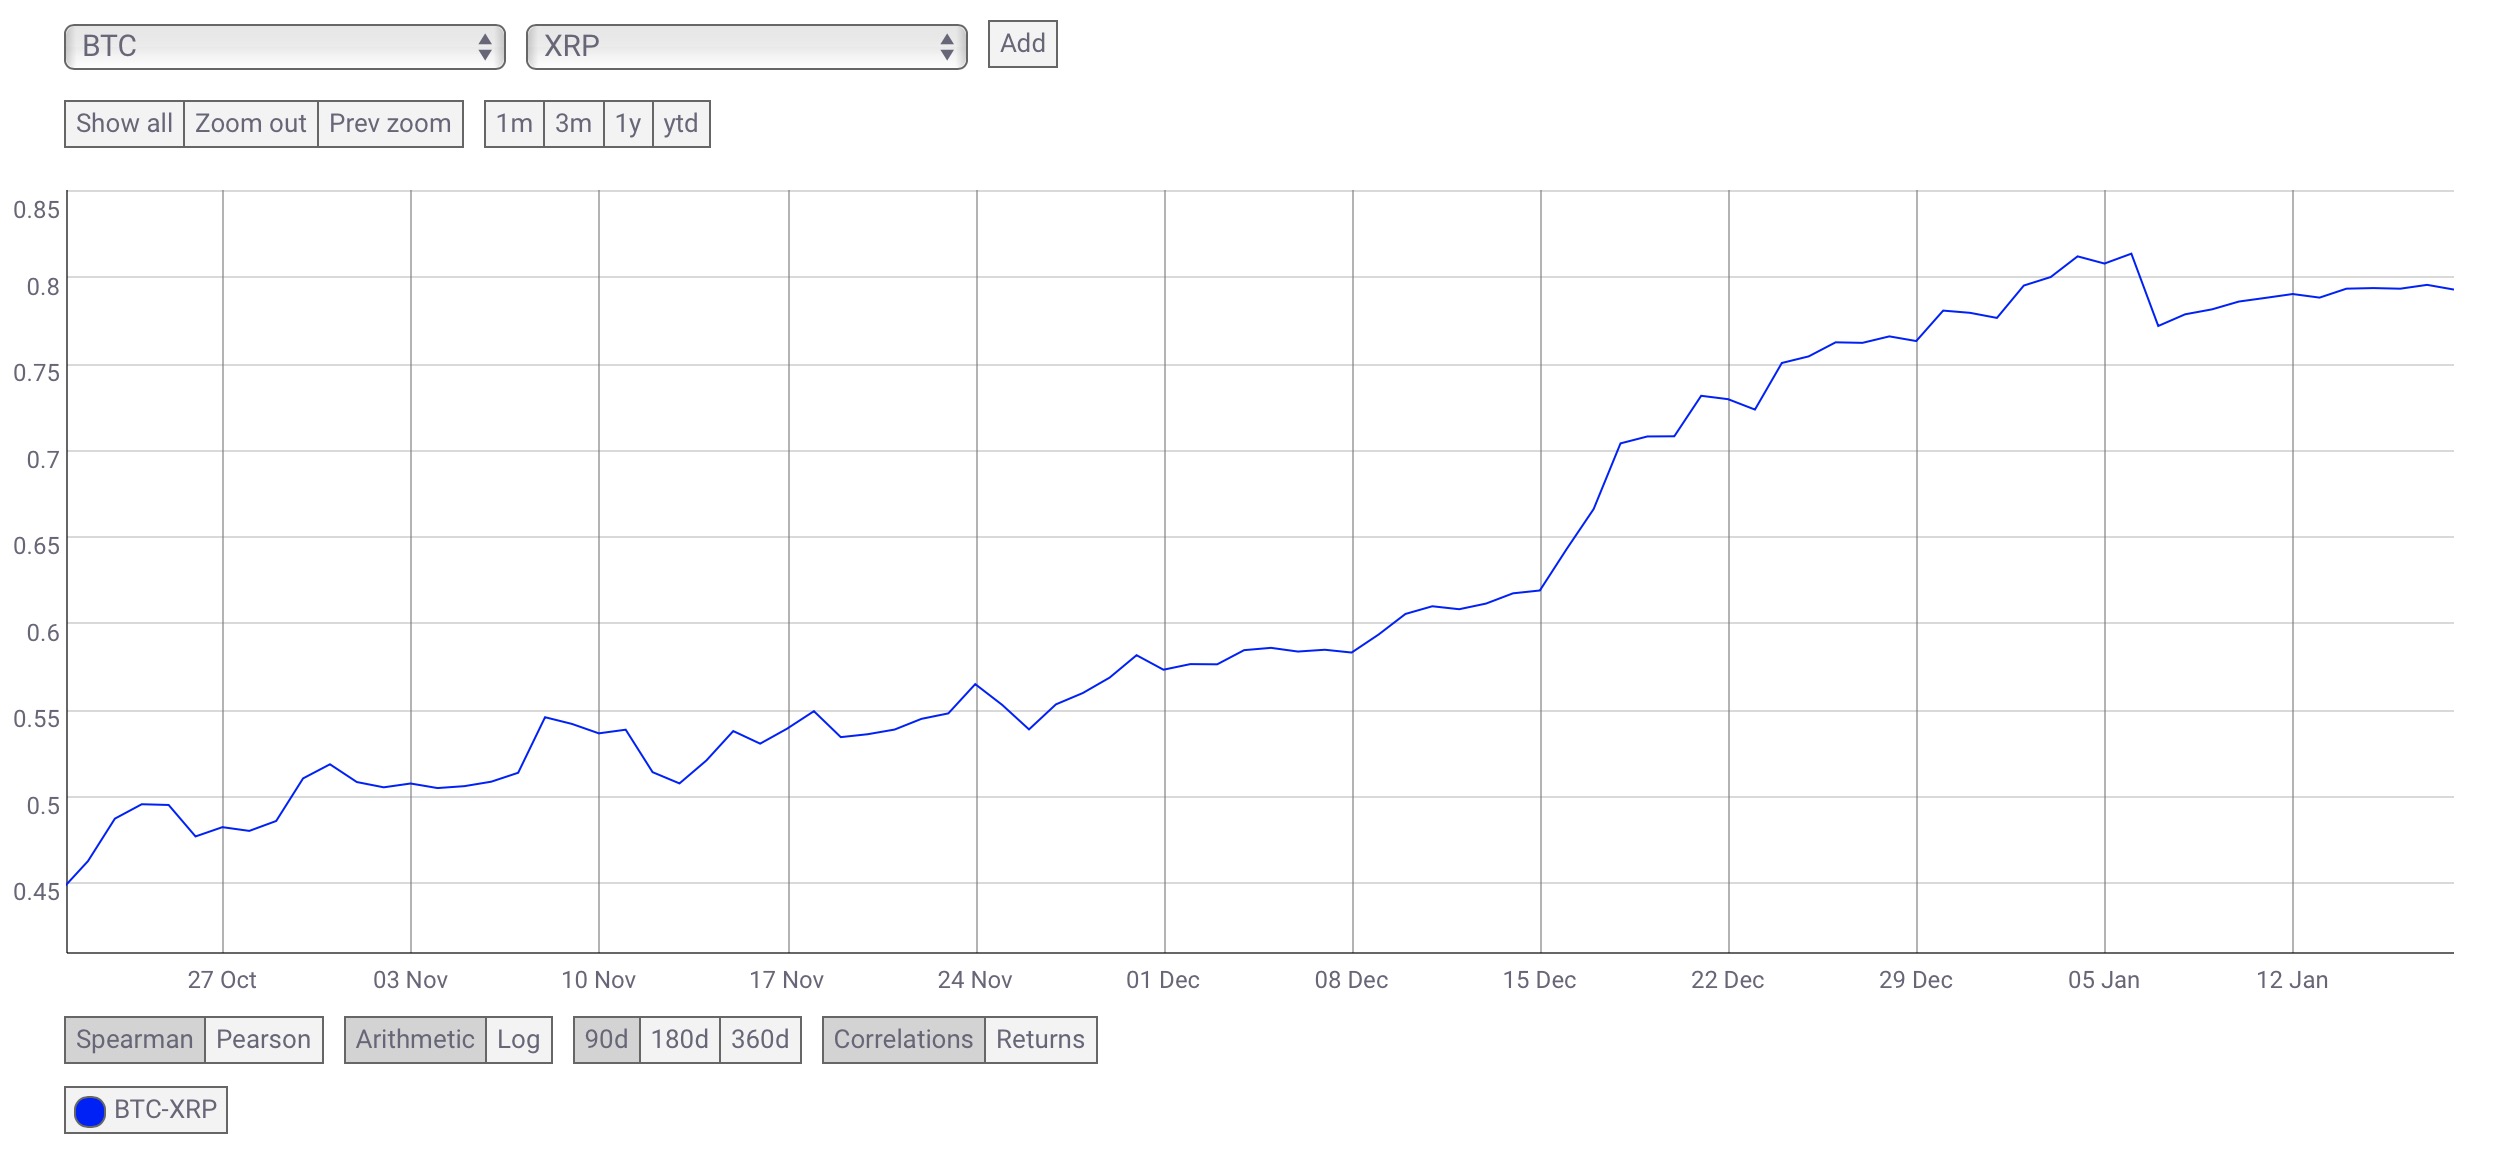
At the time of writing, Bitcoin fell from over $9100 to around $8600 in less than an hour. This is likely the reason for the latest candle on the XRP chart closing under the 78.6% Fibonacci retracement line. CoinMetrics‘ data on XRP correlation with Bitcoin has been on the rise since late-October and other than a small dip back under the 0.8 mark, the correlation has been steadily rising since the start of the year. Currently, with the correlation above the 0.79 mark, it is highly likely the coin will follow in Bitcoin‘s footsteps over the coming days.
Conclusion
The strong correlation with Bitcoin and XRP’s tendency to move through this fractal pattern indicate that the coin will move down in value, probably down to the 61.8% Fibonacci retracement line above $0.227 before the end of the month. However, if Bitcoin goes up in the short-term, strong correlation could lessen the impact of the bearish move, or even pull the value of XRP up to the 61.8% retracement line at $0.239.
The post appeared first on AMBCrypto


