Disclaimer: The following article attempts to analyze the emerging patterns in XRP’s long-term market and its impact on the price
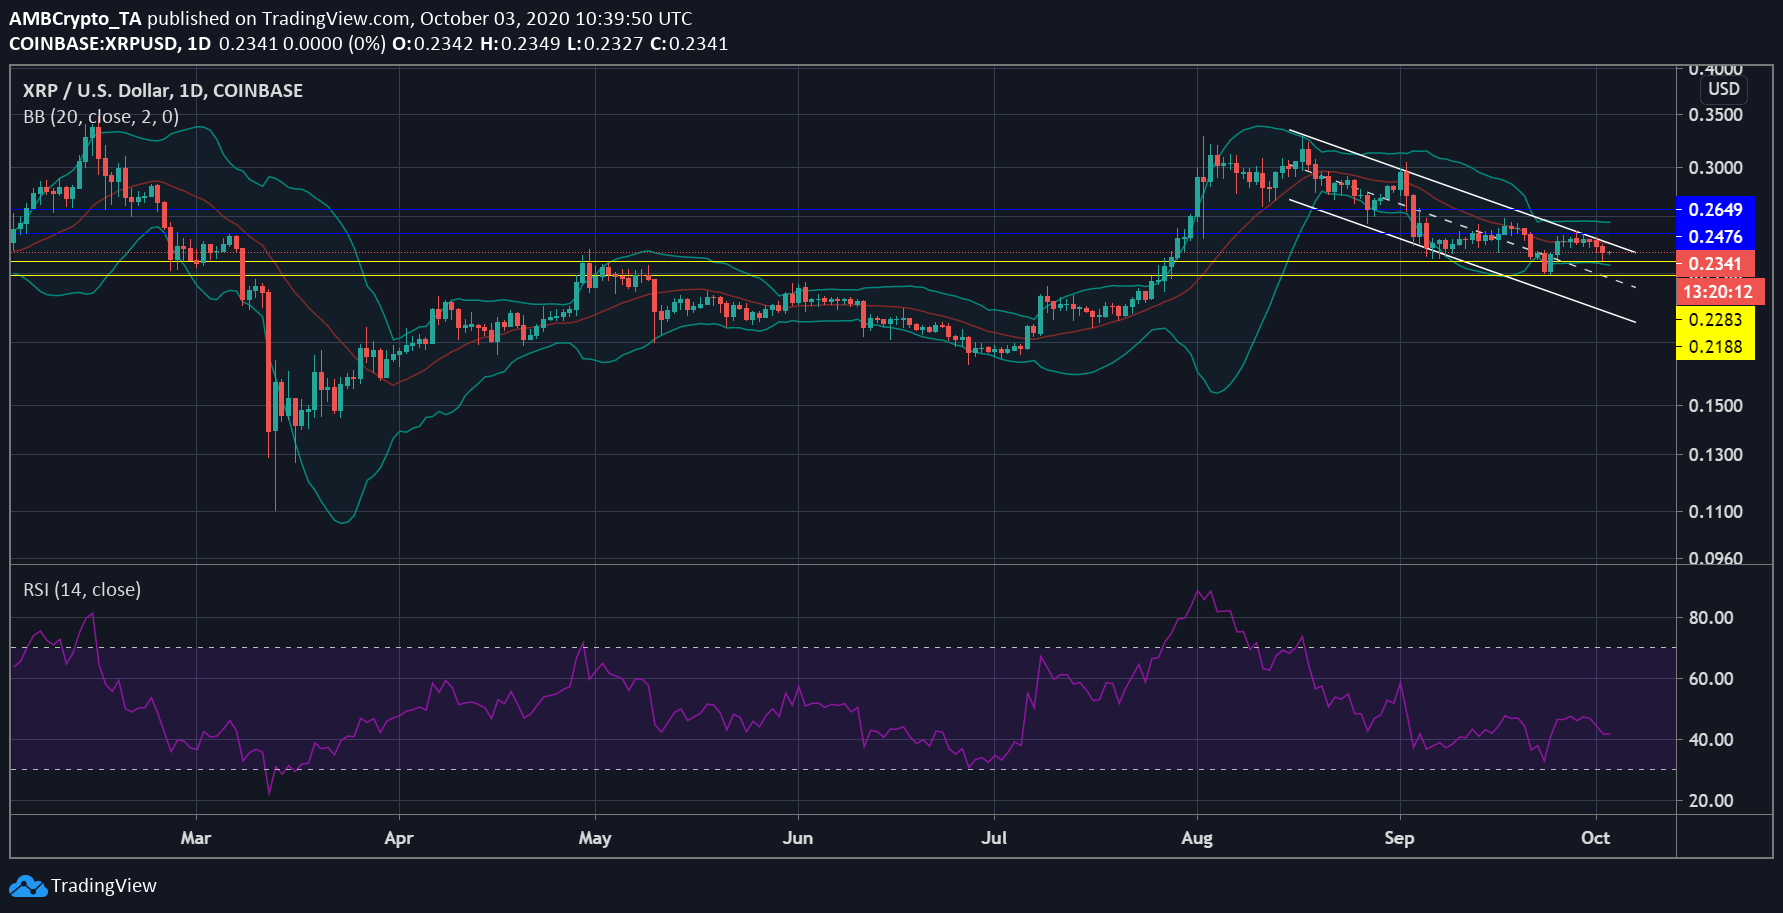
Another blow was recently dealt to the cryptocurrency market after Bitcoin’s fall, with the altseason delayed yet again despite the fact that many expected it to arrive sooner rather than later. So was the case with XRP as the market’s third-largest digital asset did not abide much by the pre-October trend. In fact, XRP’s value has been falling since mid-August and the same was consolidating within a descending channel, at press time.
The value of the crypto-asset was restricted around $0.2342, as its price kept slipping after testing the resistance at $0.2476 on the charts.


Source: XRP/USD on TradingView
Given the devaluation, XRP’s daily chart marked immediate resistance levels at $0.2476 and $0.2649. Similarly, the support level was also marked close to the press time value at $0.2283 and $0.2188. Although the volatility in the market had reduced, as indicated by the convergence of Bollinger Bands, the signal line moved above the price bars. The trend, thus, was siding significantly by the bears as the price was also noting a gradual dip on the charts.
On the contrary, the Relative Strength Index was underlining that XRP was moving towards the oversold zone. In fact, it recently bounced from 32 towards the equilibrium zone, with the same noted to be at 41, at press time. As the chart formed a fourth consecutive red candle, the RSI also pictured a downward curve, indicating the sale of the digital asset.


Source: XRP/USD on TradingView
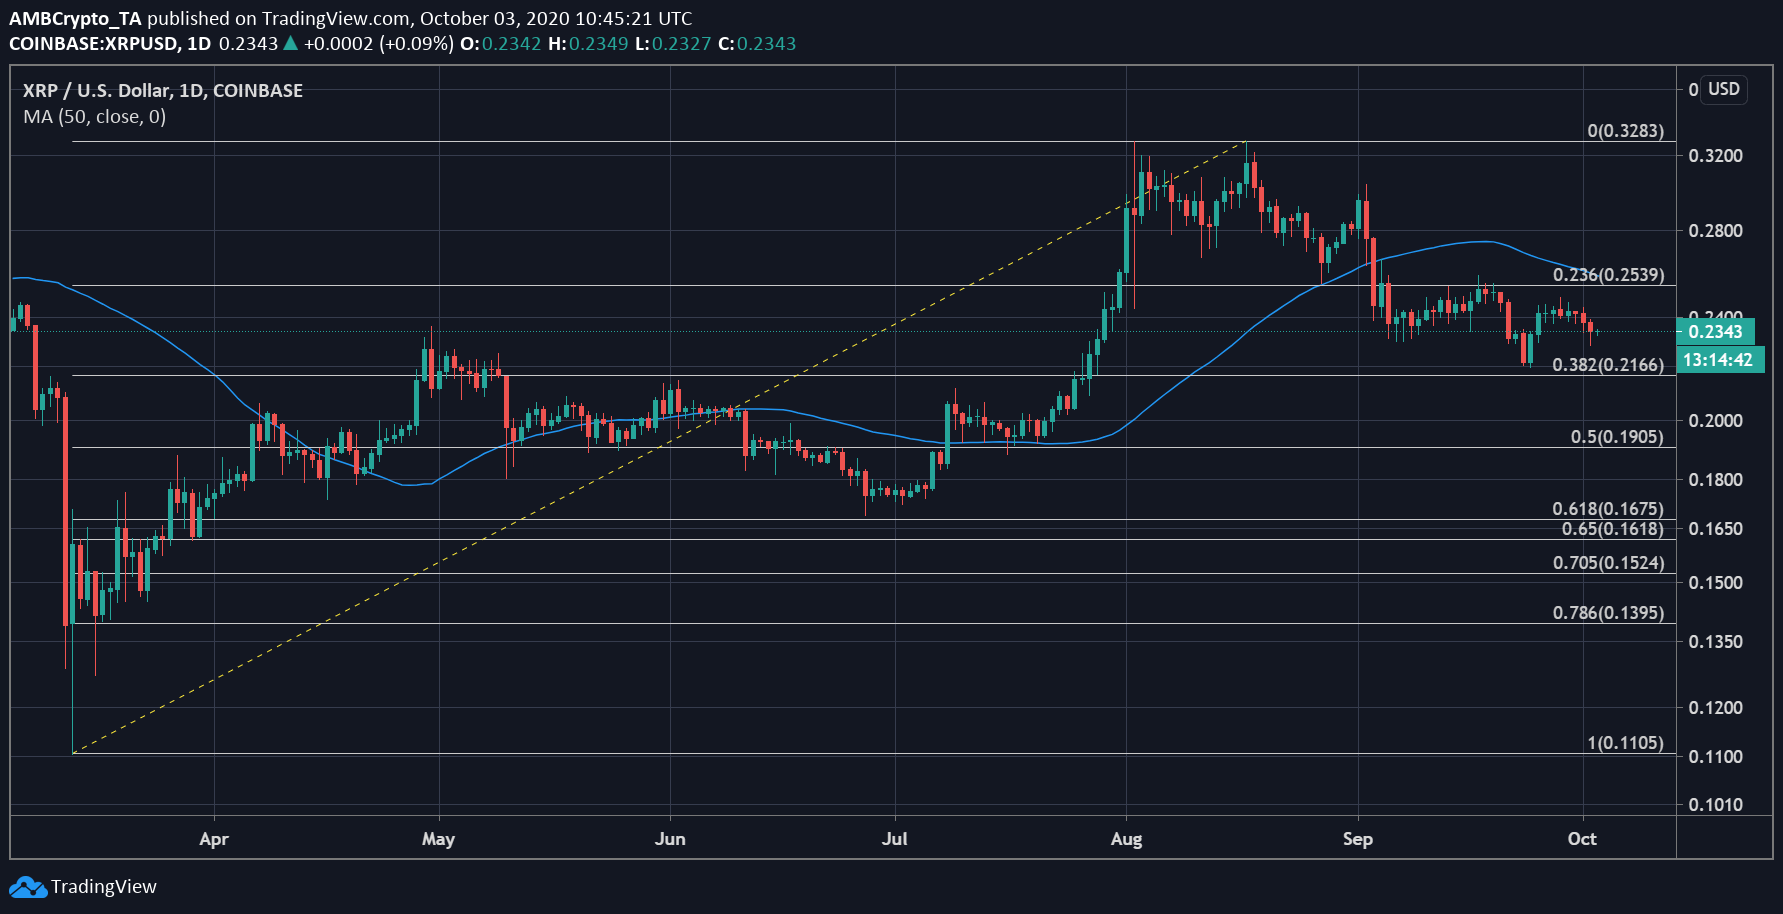
Considering the period from the March dip, the Fib retracement showed that the coin’s price had recovered significantly. However, the 50 moving average still suggested that bears were looming in the market.
XRP has been consolidating between $0.2539 and $0.2166 since the beginning of September. While the coin tried to breach the resistance, it soon retracted with a sell-off. At the time of writing, the price was approaching the support for the second time. However, given the bearishness, it may dip even further, along with the support, as this price level has not been tested often within the given period.
The post appeared first on AMBCrypto


