While XRP has struggled to get on the immediate bullish scene with the rest of the industry, its long-term credentials were playing right in its path. With the price consolidating above the immediate support of $0.230 after the crash on October 1st, the valuation has done well to keep a position above $0.249.
While it is easy to state that XRP is reacting to the collective market more than relying on its own ability, the fact that it has continued to stay above a major downtrend, highlighted its strength from a bullish prespective.
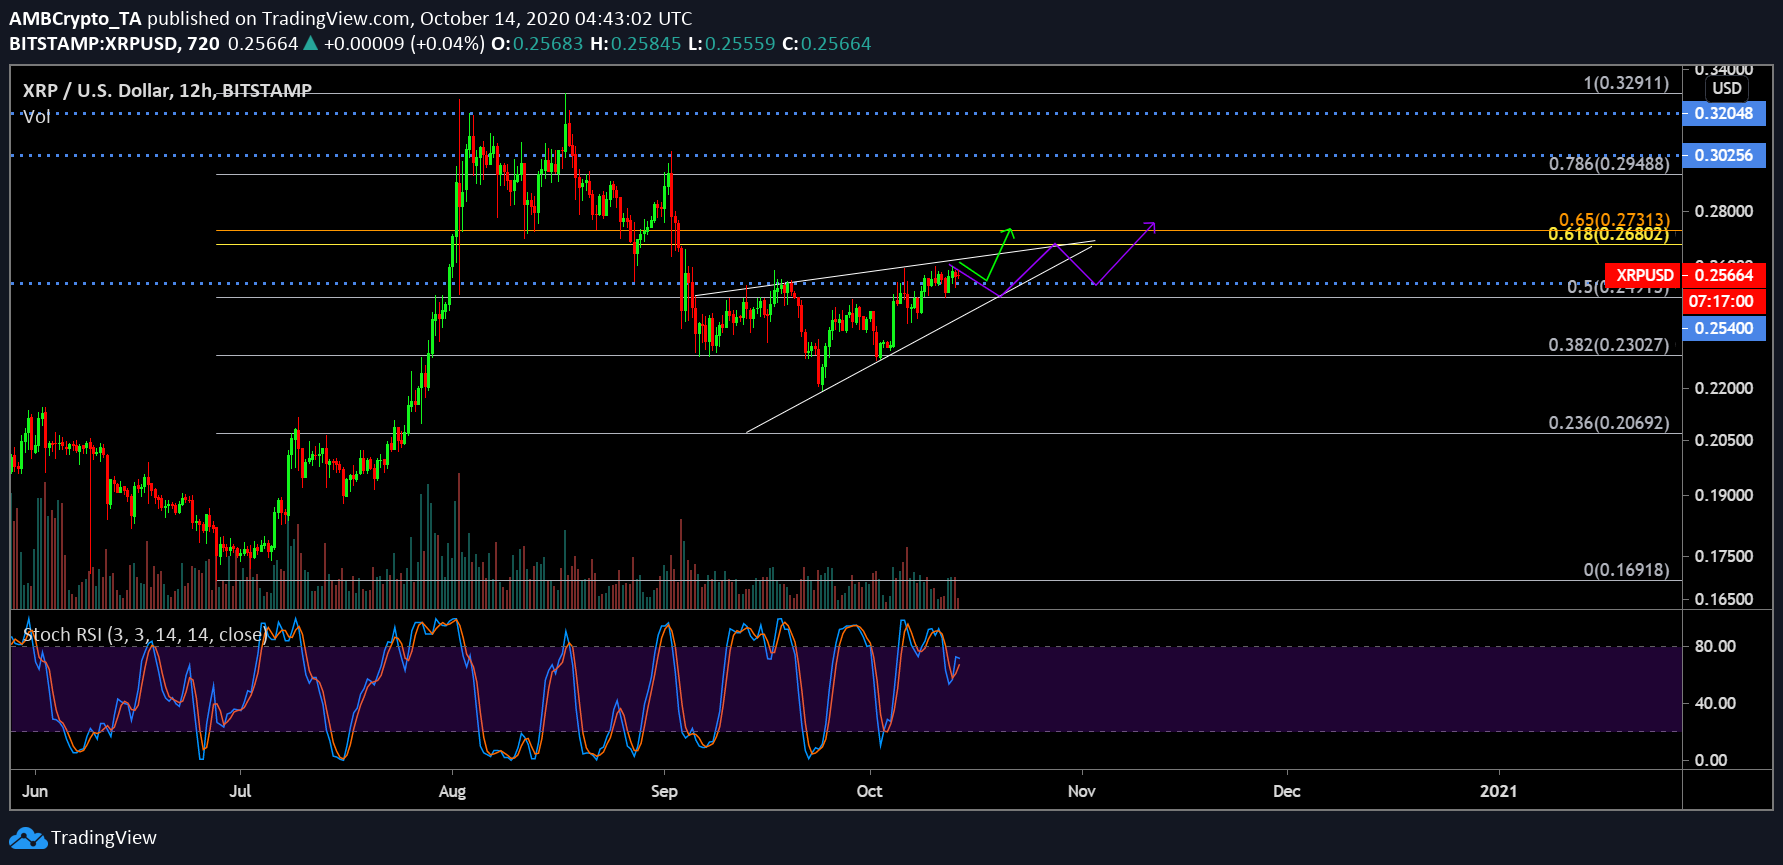
XRP 12-hour chart
The 12-hour chart tells us a couple of narratives that may play out over the next few weeks. The first remains a breakout from the rising wedge but invalidating its bearish implications, the price may move upwards rather than heading south (directed by the green arrow path). The second price path indicated by the purple line may see the valuation oscillate between the pattern before breaking bearish, and bouncing back from $0.254-$0.249.
The support at $0.249 is illustrated by the 0.5 Fibonacci line and $0.254 has been an active trading range over the past few weeks.
With the Stochastic RSI hinting towards a minor pullback at the moment, the likelihood of the token attaining movement between the pattern increases.
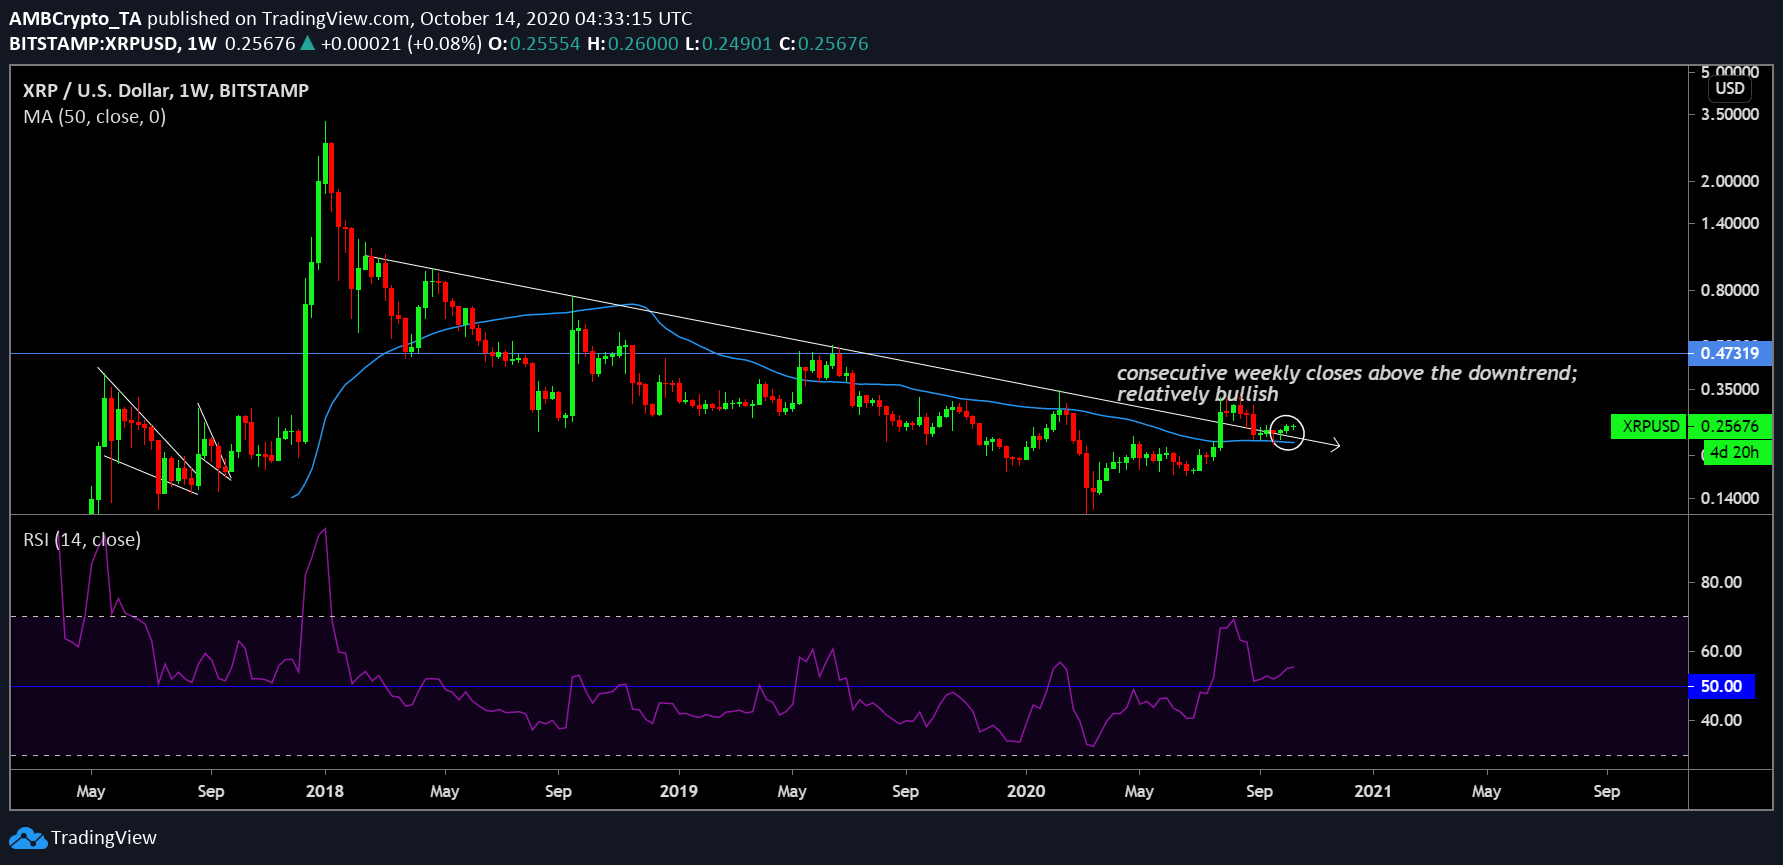
XRP 1-week chart
The 1-week chart for XRP remains instrumental for the proponents to garner a sense of optimism. As witnessed, the weekly candle has registered consecutive weeks above the downtrend dating back to 2018. For a while in August-Sept, the token looked destined to fall back under the bearish trend but the token rallied to stay above the margin.
The price also continued to incur consistent underlying support from the 50-Moving Average, further verifying the existence of a bullish trend. The bears haven’t made a substantial impact on the long-term charts yet as the buying pressure has consistently remained at the bay of the buyers. RSI indicated that buying pressure has kept the marker above 50 since the start of September, which hasn’t change in spite of corrections over the past few weeks.
Right now, it seems like the current price range is going to be the base for XRP’s rally in the coming weeks.
The post appeared first on AMBCrypto


