XRP’s price recorded substantial gains on the charts as the month of July came to a close. Surprisingly, since the start of August, this trend has reversed slightly, with the price failing to break key resistances a few times. However, the price of the market’s fourth-largest cryptocurrency may be gearing up for yet another surge as it seemed to be inching closer to its immediate resistance.
At press time, XRP was being traded at $0.297, with the cryptocurrency having a market cap of $13.4 billion. Over the past 24-hours, XRP’s price noted slight gains of 0.32 percent, with a 24-hour trading volume of $2.2 billion.
XRP 4-hour chart

Source: XRP/USD, TradingView
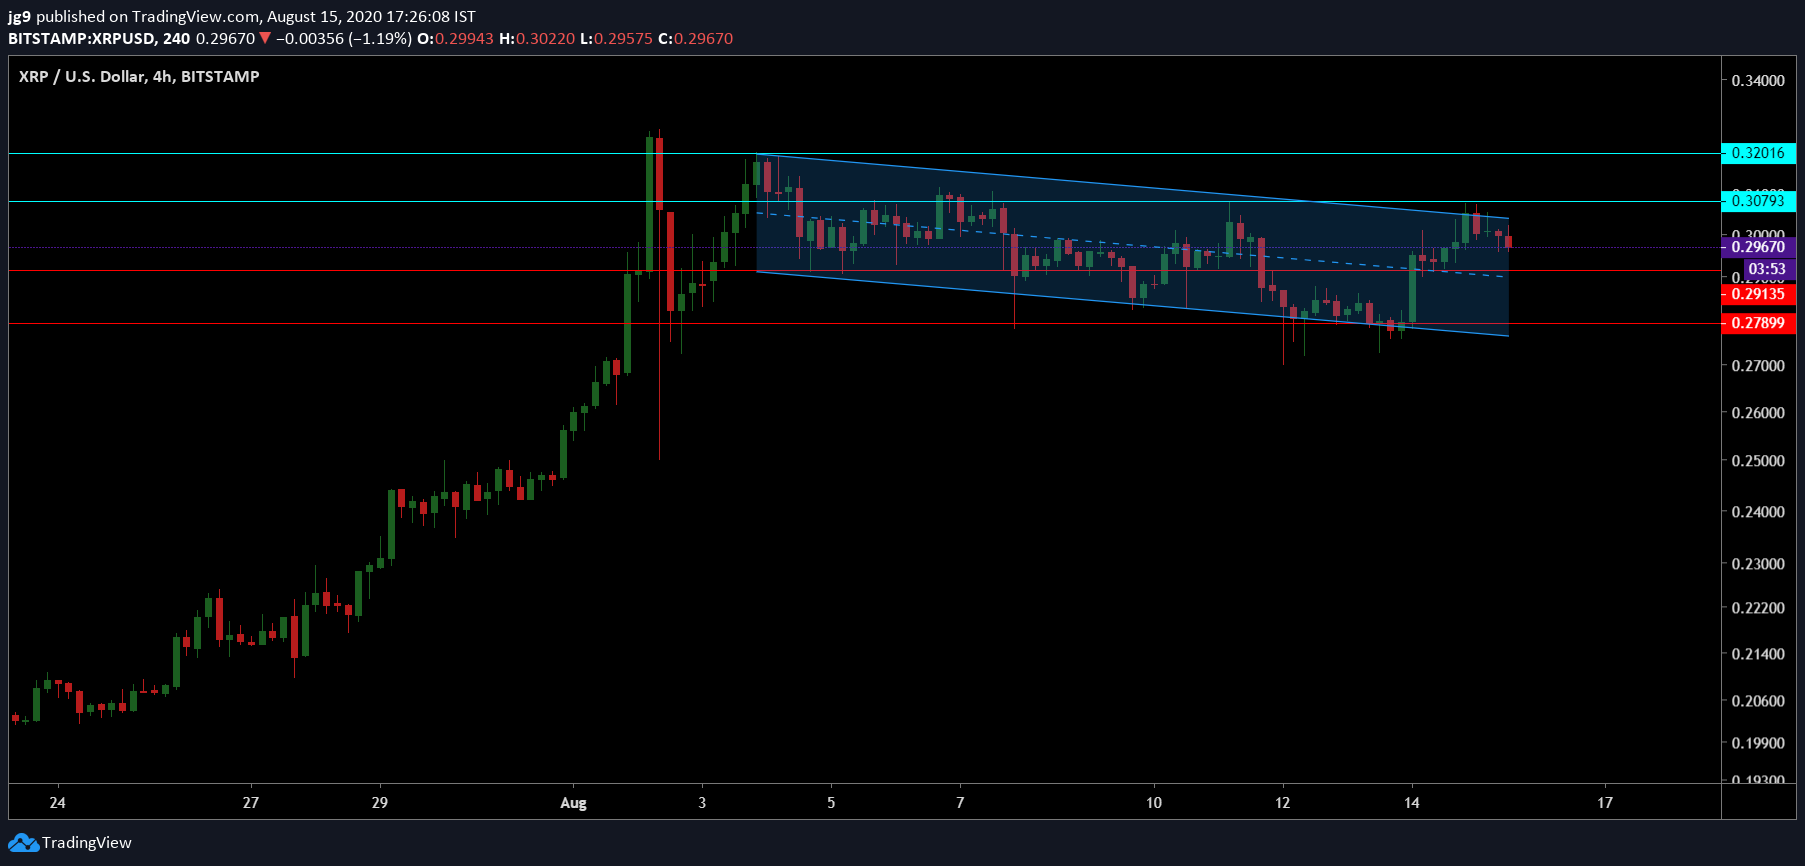
According to XRP’s 4-hour chart, the price was continuing to be in a descending channel price formation. The trading price of the coin has been within the bounds of the descending channel right from the start of the month and is expected to move upwards once it breaks out. This would result in the price of XRP heading towards its immediate resistance of $0.307 – a price point that has been repeatedly tested this week.
If the bullish momentum were to sustain in the coming weeks, XRP may find itself heading towards its resistance at $0.320 – a price level the coin found itself at towards the start of the month.
However, if the price fails to gather enough bullish momentum and remains within the channel, the price may be forced to test the support at $0.291.

Source: XRP/USD, TradingView
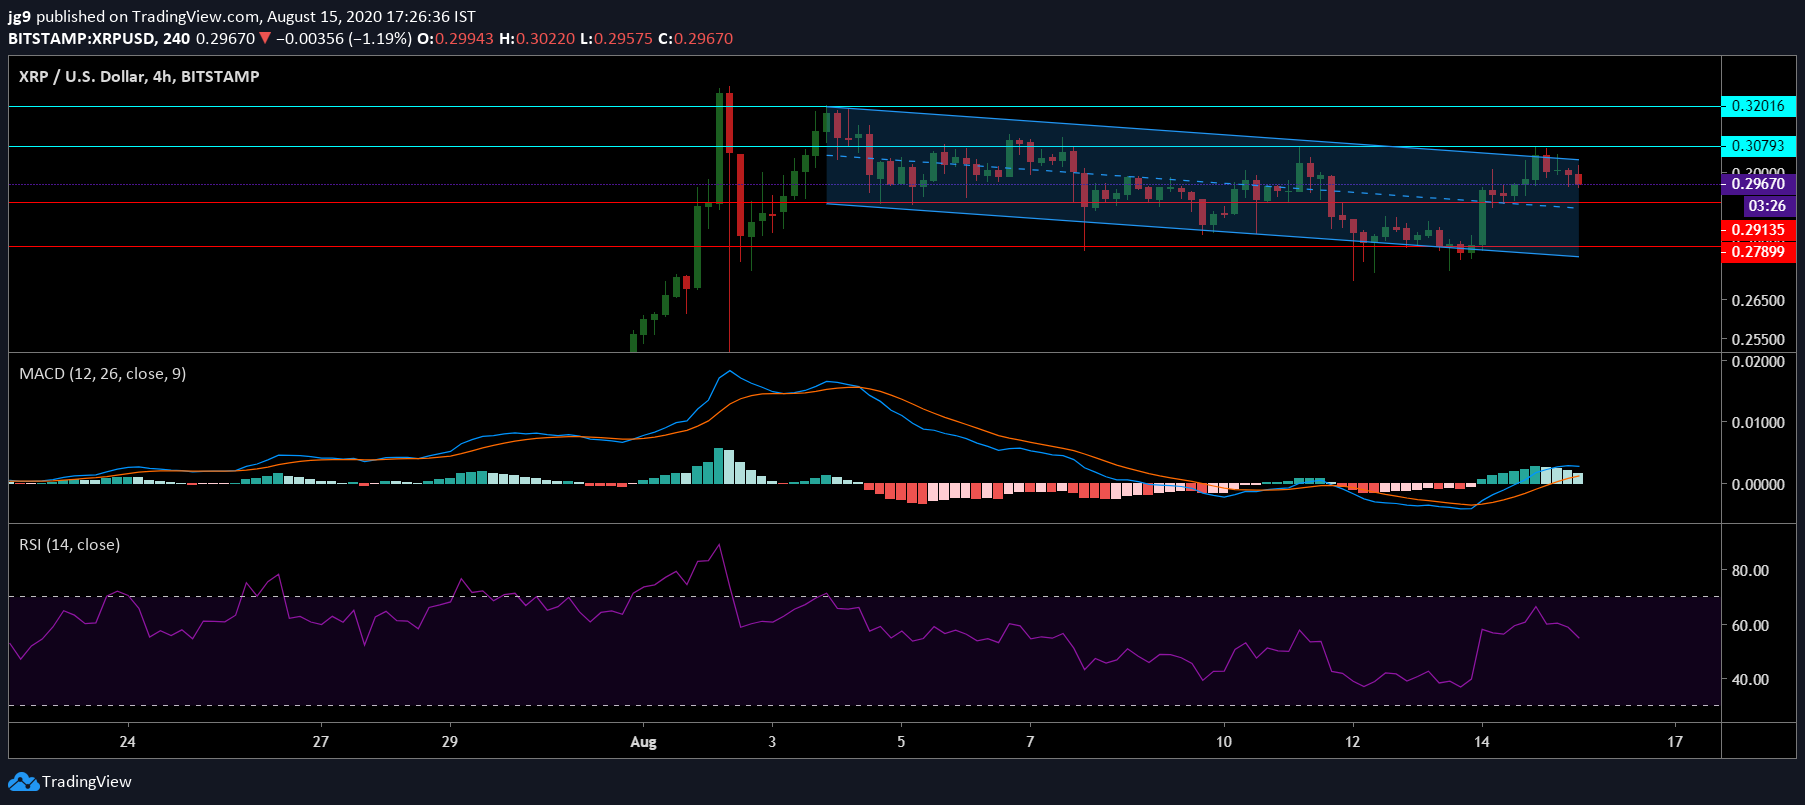
According to XRP’s indicators on the 4-hour chart, the MACD signaled upward price movement after having undergone a bullish crossover. The Relative Strength Index, on the other hand, showed minor divergence as it headed away from the overbought zone.

Source: CoinMetrics
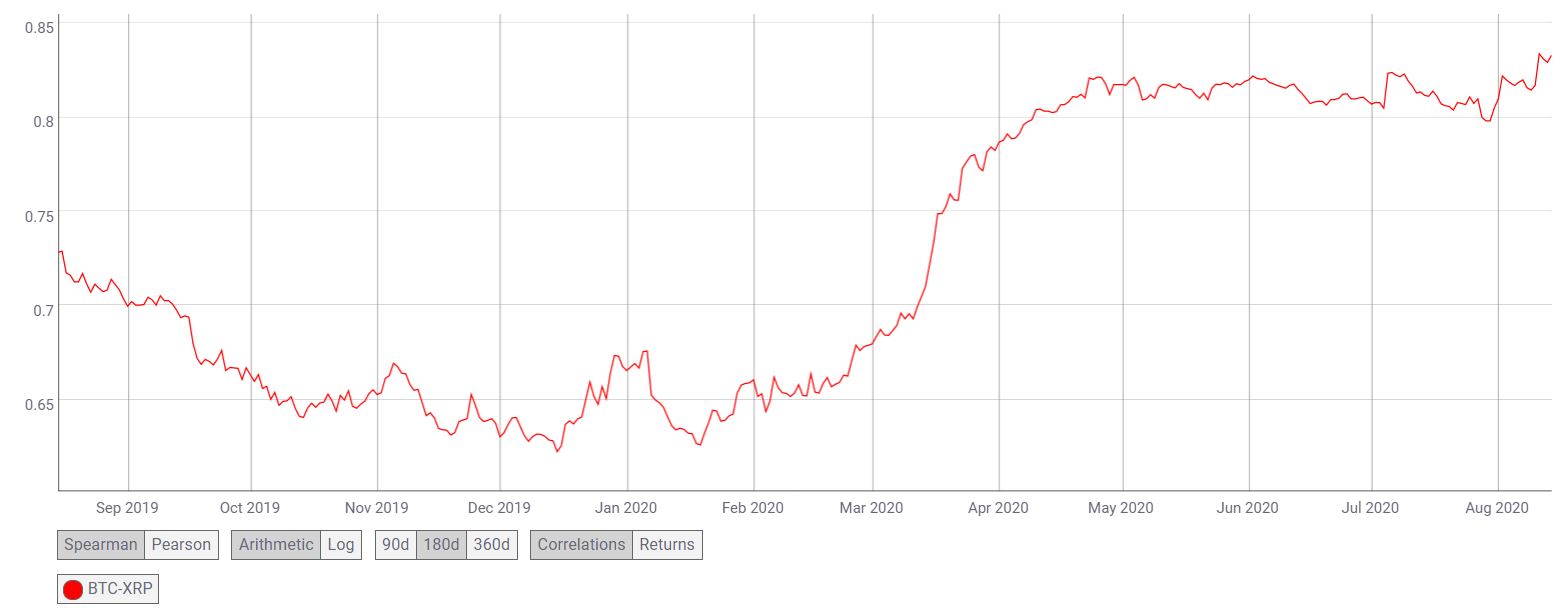
Further, CoinMetrics’ data suggested that the correlation between Bitcoin and XRP continued to remain fairly high. During the course of the past year, this bond between BTC and XRP has strengthened and has risen from 0.72 and 0.83.
Conclusion
XRP’s price action is likely to break out of the descending channel in the coming week and is likely to head towards the immediate resistance of $0.307 in the next few days. However, in terms of its long-term price movement, if the bullish momentum were to continue, the coin may end up moving towards its early-August price point.
On the contrary, if the price were to be confined within the descending channel, then the price may see a minor drop and head towards the support at $0.291.
The post appeared first on AMBCrypto


