Disclaimer: The following price prediction should not be taken as investment advice as it is the opinion of the writer.
Unlike other top digital currencies in the space, XRP struggled to respond after the collective industry collapsed between 1st-2nd Septemeber. With Bitcoin and Ethereum making significant strides in their recovery, XRP failed to move above its immediate resistance at $0.254. With the market appearing a little bearish again, the chances of further depreciation are currently rising. At press time, XRP was valued at $0.240, with a market cap of $11.4 billion.
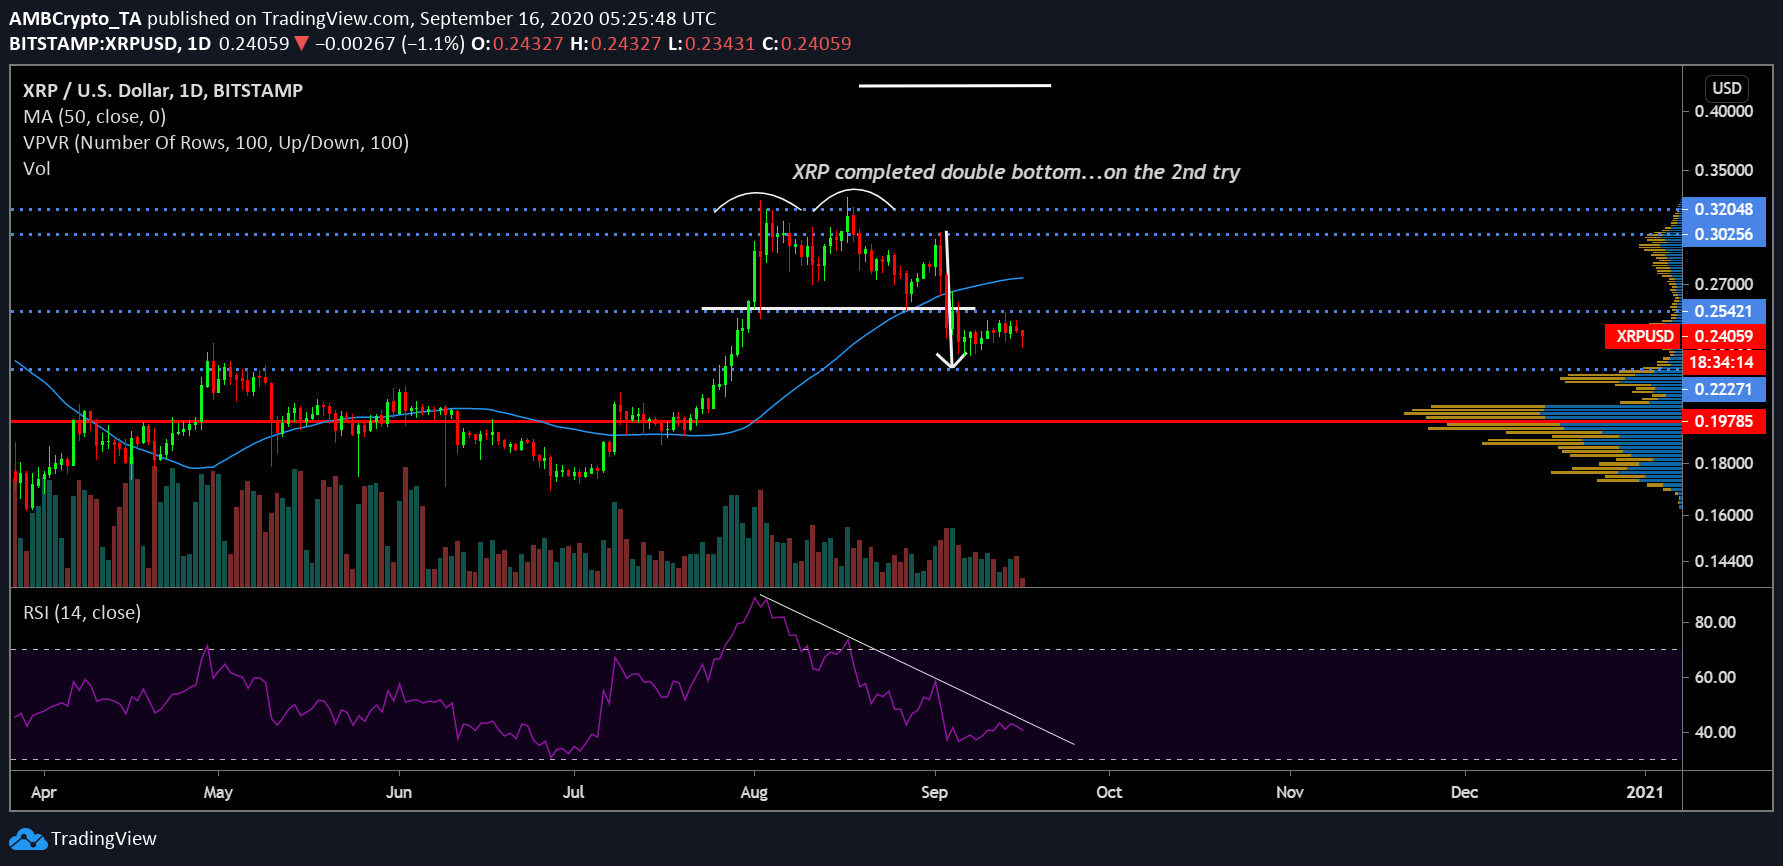
XRP 1-day chart
If the 1-day chart is closely observed, XRP seemed bound for a bearish breakout on 27th August itself when the asset almost completed a double-bottom pattern. However, after a brief recovery, the price dumped its valuation again, and the long-term bearish pattern carried the asset below the resistance of $0.254.
The underlying support predisposed by the 50-Moving Average was also invalidated in the charts, as the price plummeted under the indicator. The declining volume held true to its decreasing activity after the price registered a high on 1st August. The Relative Strength Index or RSI has maintained its order of decline as well, as the indicator suggested the gradual decrease of buying pressure in the charts.
With respect to the current market situation, XRP is likely to re-test immediate support at $0.222 over the next few weeks but the major issue in terms of reversing the current bearish trend can be observed in the weekly chart.
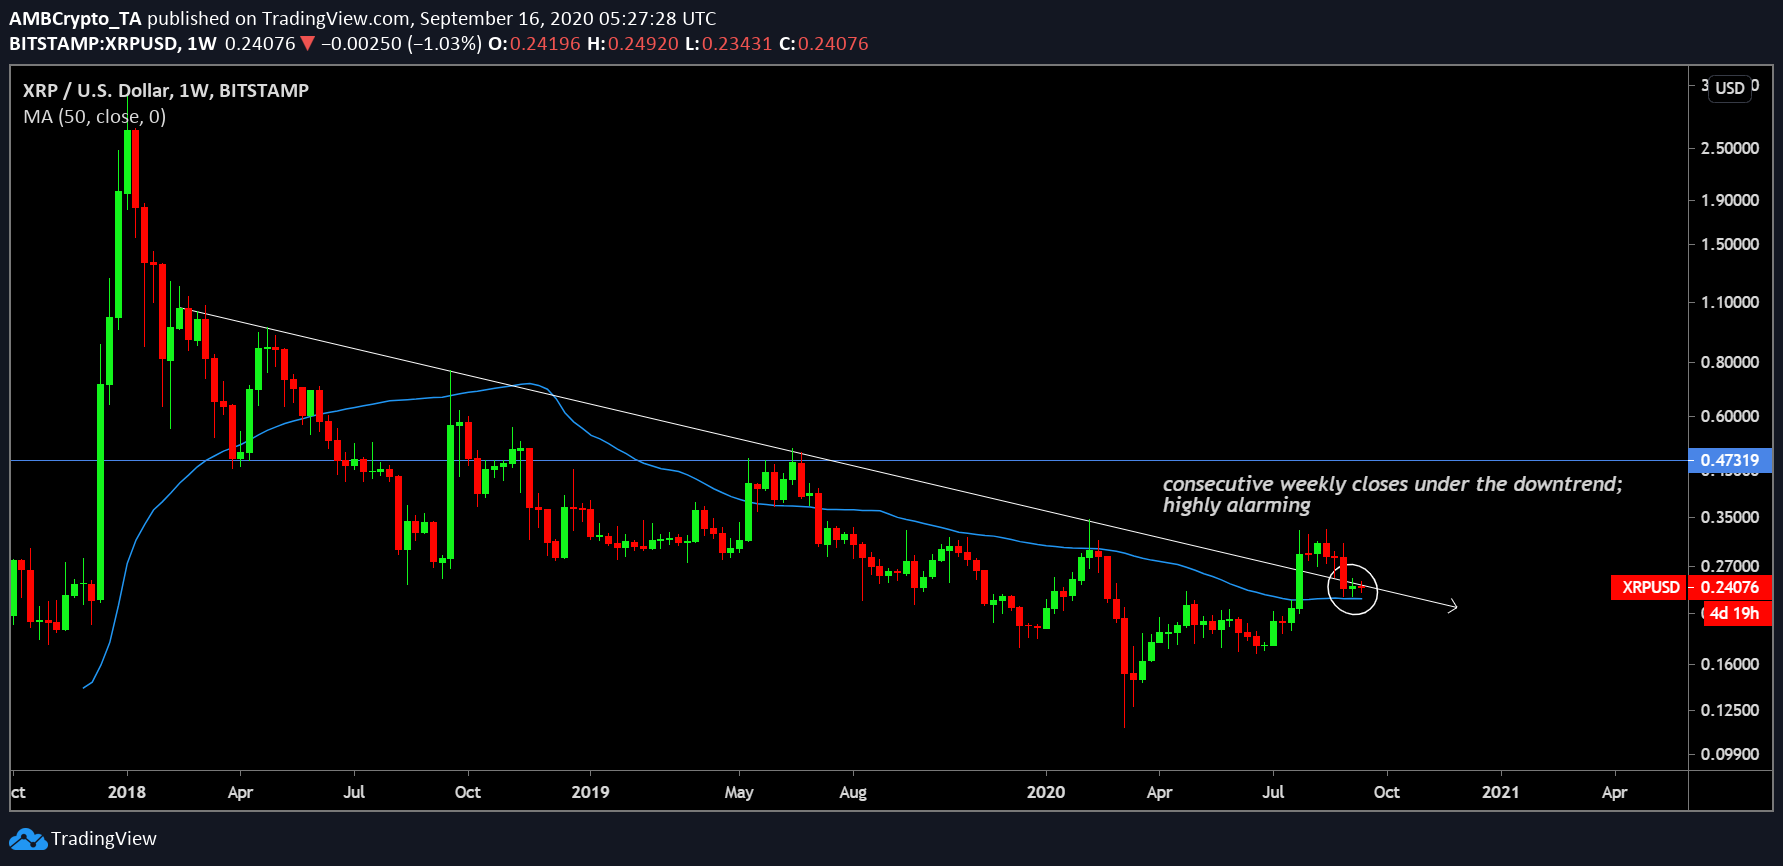
XRP weekly chart
Over the past few analyses, we discussed the fact that XRP had finally closed a weekly position over its 2-year long downtrend after the asset broke above $0.270 on the 1st week of August. Although the asset was able to close a position above the downtrend initially, now over the past couple of weeks, it is below the downtrend yet again.
Considering the token is unable to recover a position above the aforementioned downtrend in the near future, the chance of a stronger pull downwards becomes more intense. At the moment, the price is receiving support from the 50-Moving Average on the weekly time frame but for the long-term bullish trend to continue, XRP had to recovery a position above $0.250 yet again.
The post appeared first on AMBCrypto


