Disclaimer: The following price prediction should materialize over the next couple of weeks.
XRP proponents will be largely satisfied by the current performance in the digital asset industry. After breaching past an important resistance, XRP was trading above $0.222 for the first time since early March. The bullish rally also allowed the asset to reclaim its 3rd position in the chart, which it lost to Tether during last month’s crash. At press time, XRP had a market cap of $10.81 billion, with a trading volume of $2.04 billion over the past day.
1-day chart
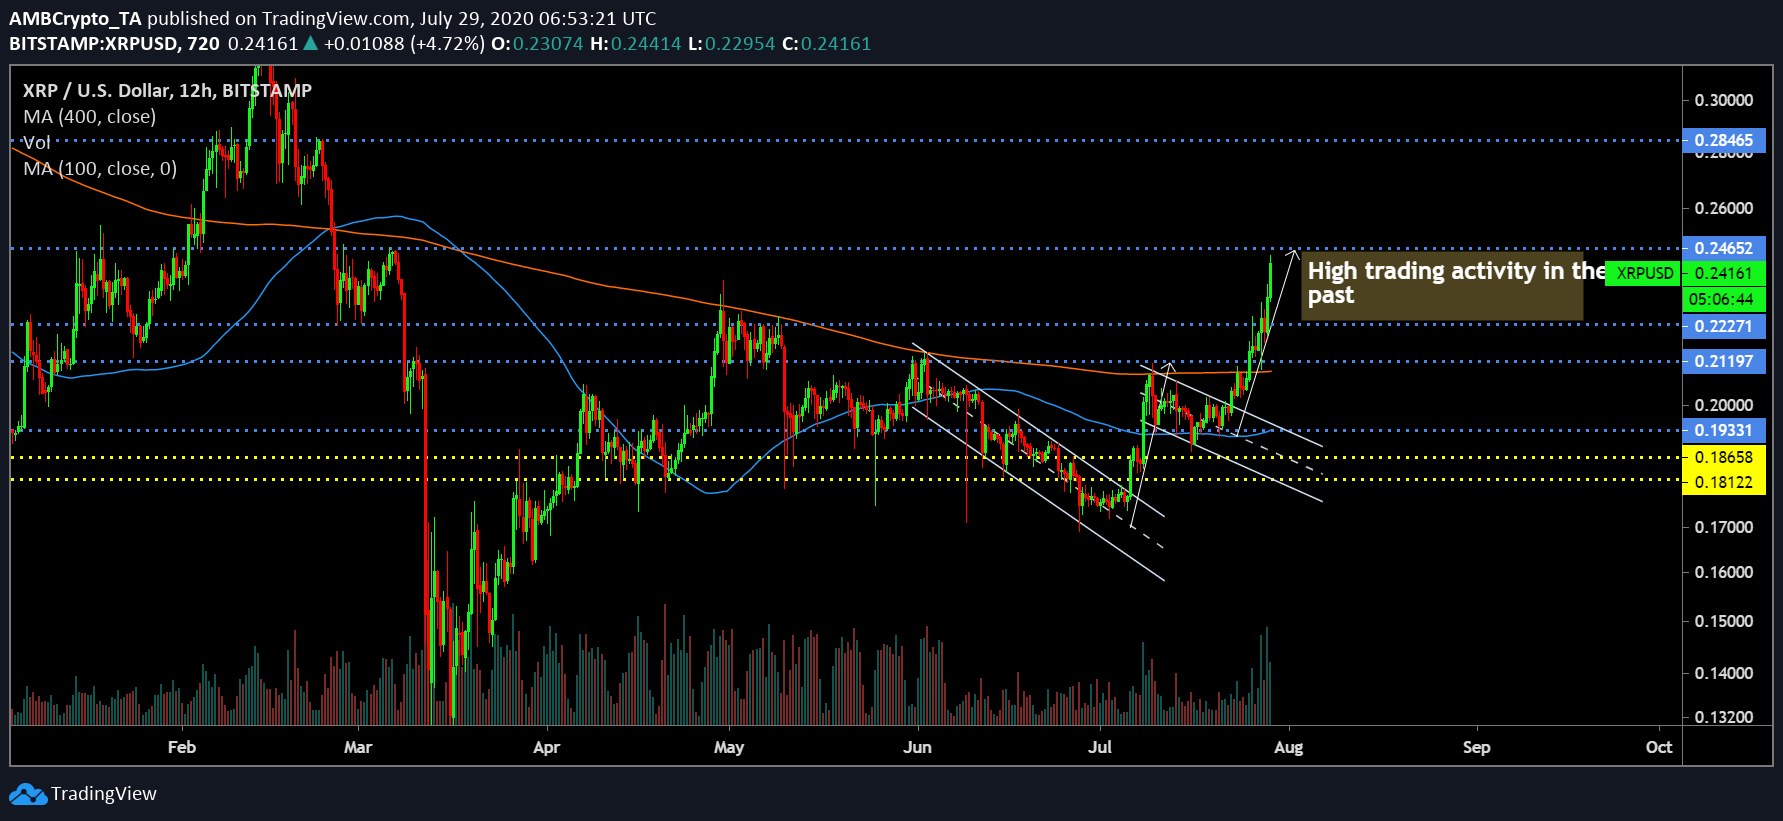
XRP’s 1-day chart pictured a couple of typical bullish breakout patterns. Since the start of June, XRP’s price movement has been largely observed between the parallel channels of two descending channel, both of which eventually registered a positive breakout. XRP’s first rally towards the start of July enabled the token to breach past resistance at $0.181, $0.186, and $0.193.
After three weeks of oscillating between the 2nd descending channel, XRP’s recent surge allowed the asset to surpass immediate resistances at $0.21 and $0.222. The resistance at $0.21 was re-tested on previous two occasions but XRP did not make it further until its recent spike.
At press time, XRP is trading at $0.241, maintaining close proximity to the resistance at $0.246. The trading zone between $0.246 and $0.222 is likely going to be XRP’s immediate price range.
During the outbreak, the token also moved above the 200-Moving Average, which had acted as strong overhead resistance since the collapse on March 13th, signifying a strong bullish scenario.
Can the bulls finally take over XRP?
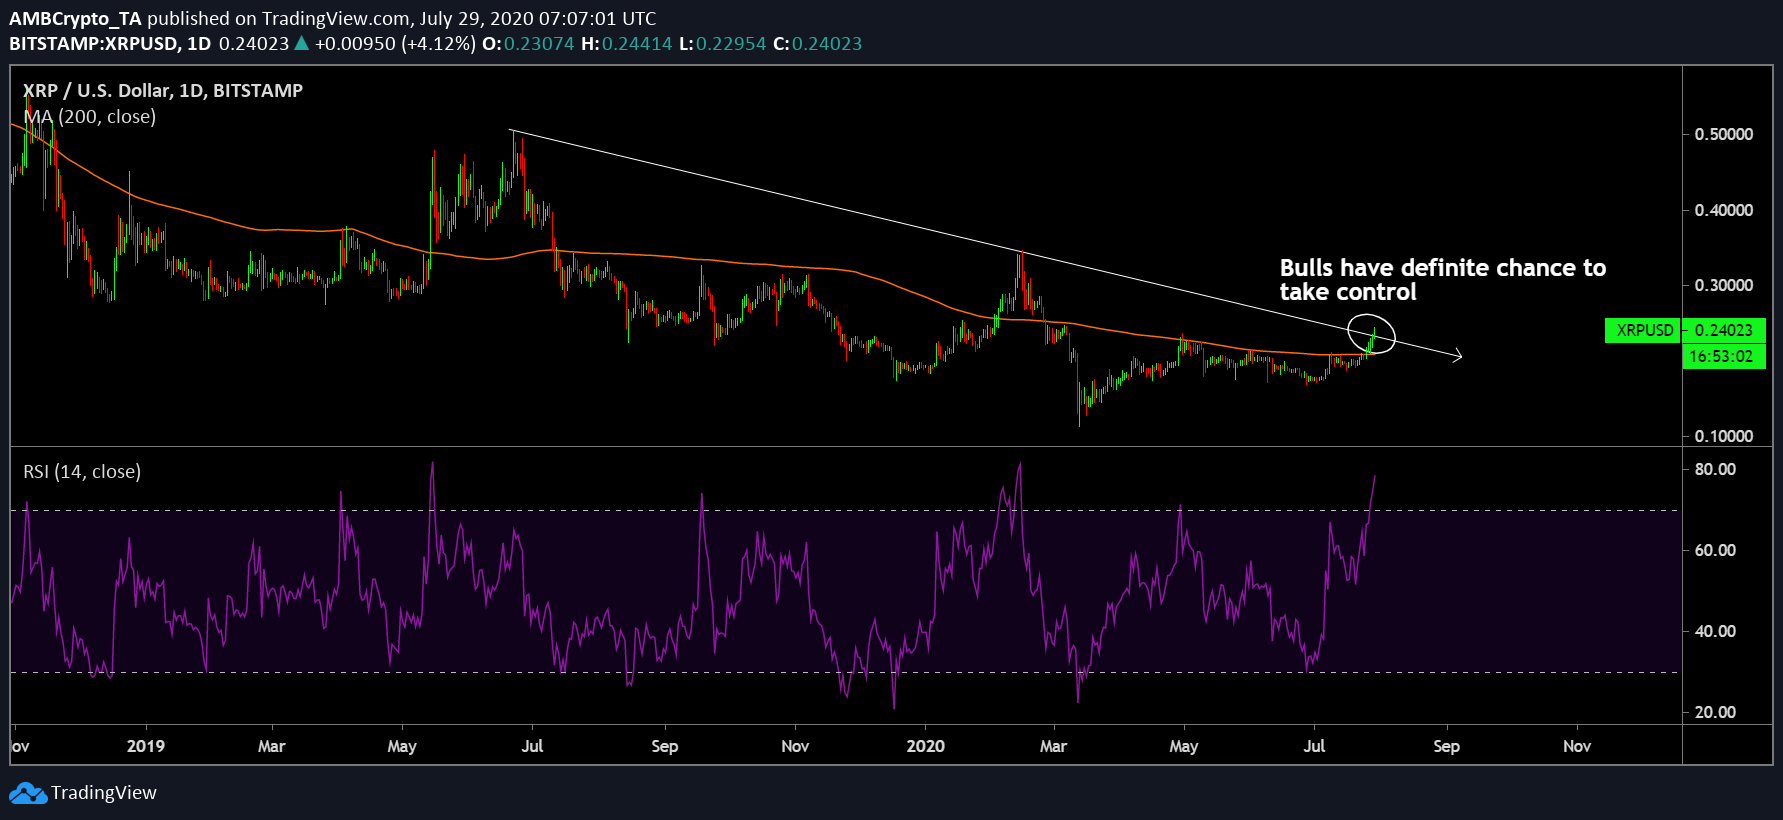
For XRP, things can take a positive turn for good as observed in the above 1-day chart. As exhibited, XRP is trying to register a positive above the long-term downtrend that has continued since the end of June 2019. The bulls have a strong possibility to take over the reins from bears but a definite position needs to be attained over the downtrend.
With Relative Strength Index or RSI on a high, the buying pressure is not lacking in momentum at the moment. The only possible setback is that from here on, selling pressure is going to come back before which XRP needs to sustain a position above this line.
Conclusion
XRP is pre-dominantly bullish after the long-term and over the next week, the asset should maintain a trading range between $0.222 and $0.246.
The post appeared first on AMBCrypto


