In sync with most of the altcoin market over the past few days, XRP’s price also took a hit as it fell by close to 15 percent on the charts. Since then, the cryptocurrency has been confined below the $0.257 price range, a development that seems to have undone the gains XRP noted over the past month.
At press time, XRP was being traded at $0.24, while registering a market cap of $11.2 billion. Over the past 24-hours, XRP’s price had depreciated by close to 3 percent, while registering a 24-hour trading volume of $1.7 billion.
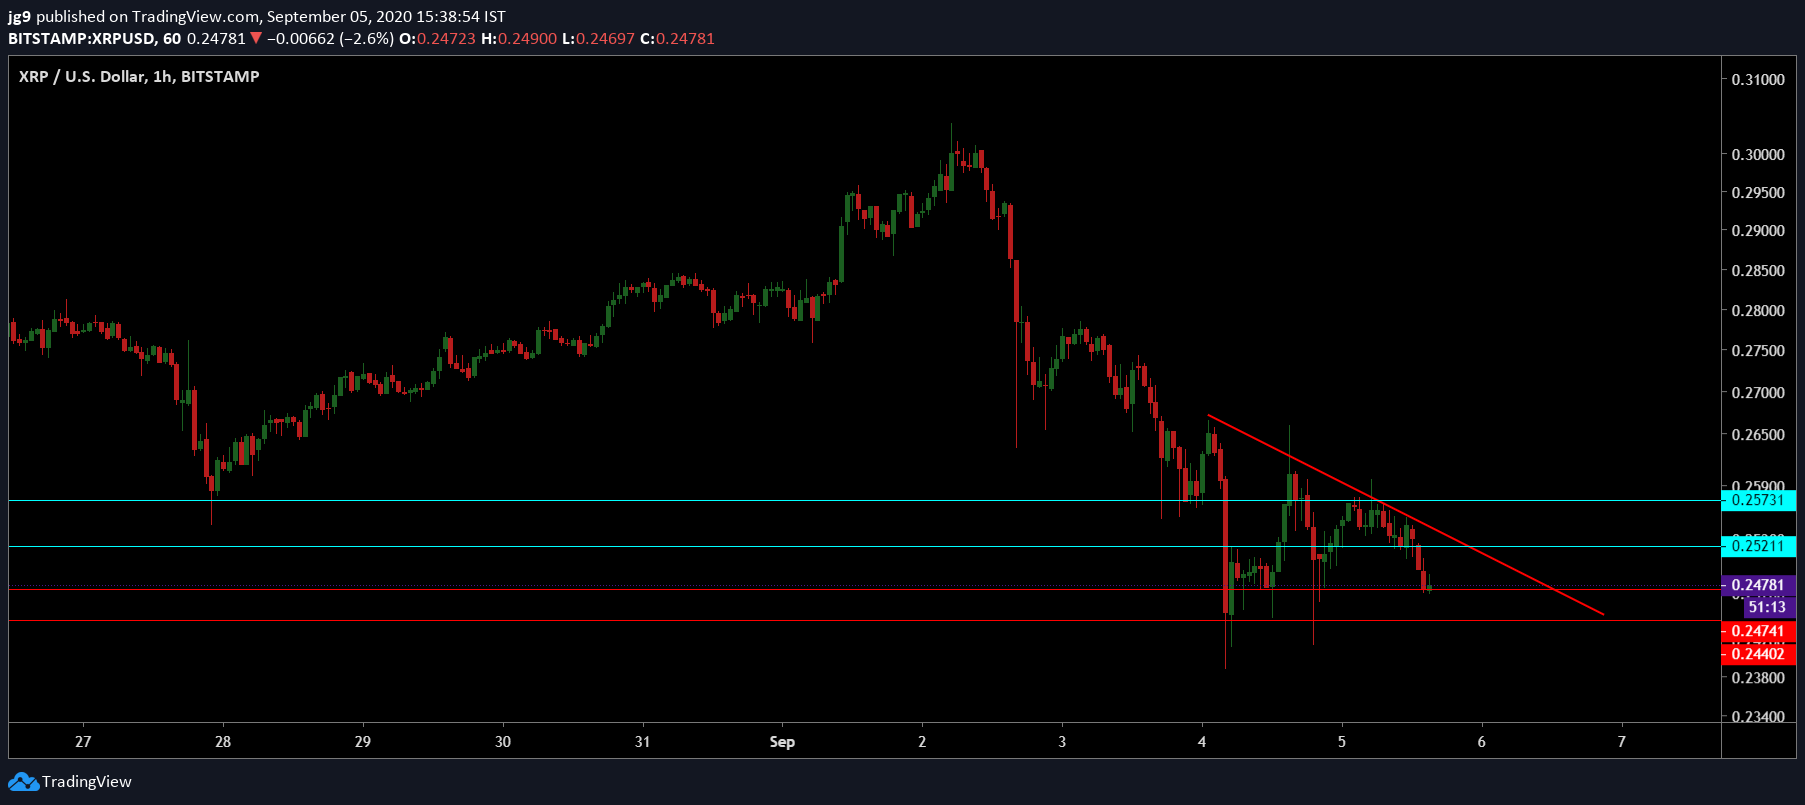
XRP 1-hour chart


Source: XRP/USD, TradingView
According to XRP’s hourly chart, the cryptocurrency’s price movement has been confined to a descending channel formation since yesterday. While a breakout north is normally expected for such a formation, XRP’s price is likely to remain within the formation over the next 24-hours.
At press time, the coin was testing its support level at $0.247. However, if the bearish pressure were to persist, in line with the formation at hand, a further dip on the charts towards the next point of support at $0.244 can be expected. In the unlikely scenario of the coin’s price immediately breaking out, then it will have to overcome the resistance levels at $0.252 and $0.257.


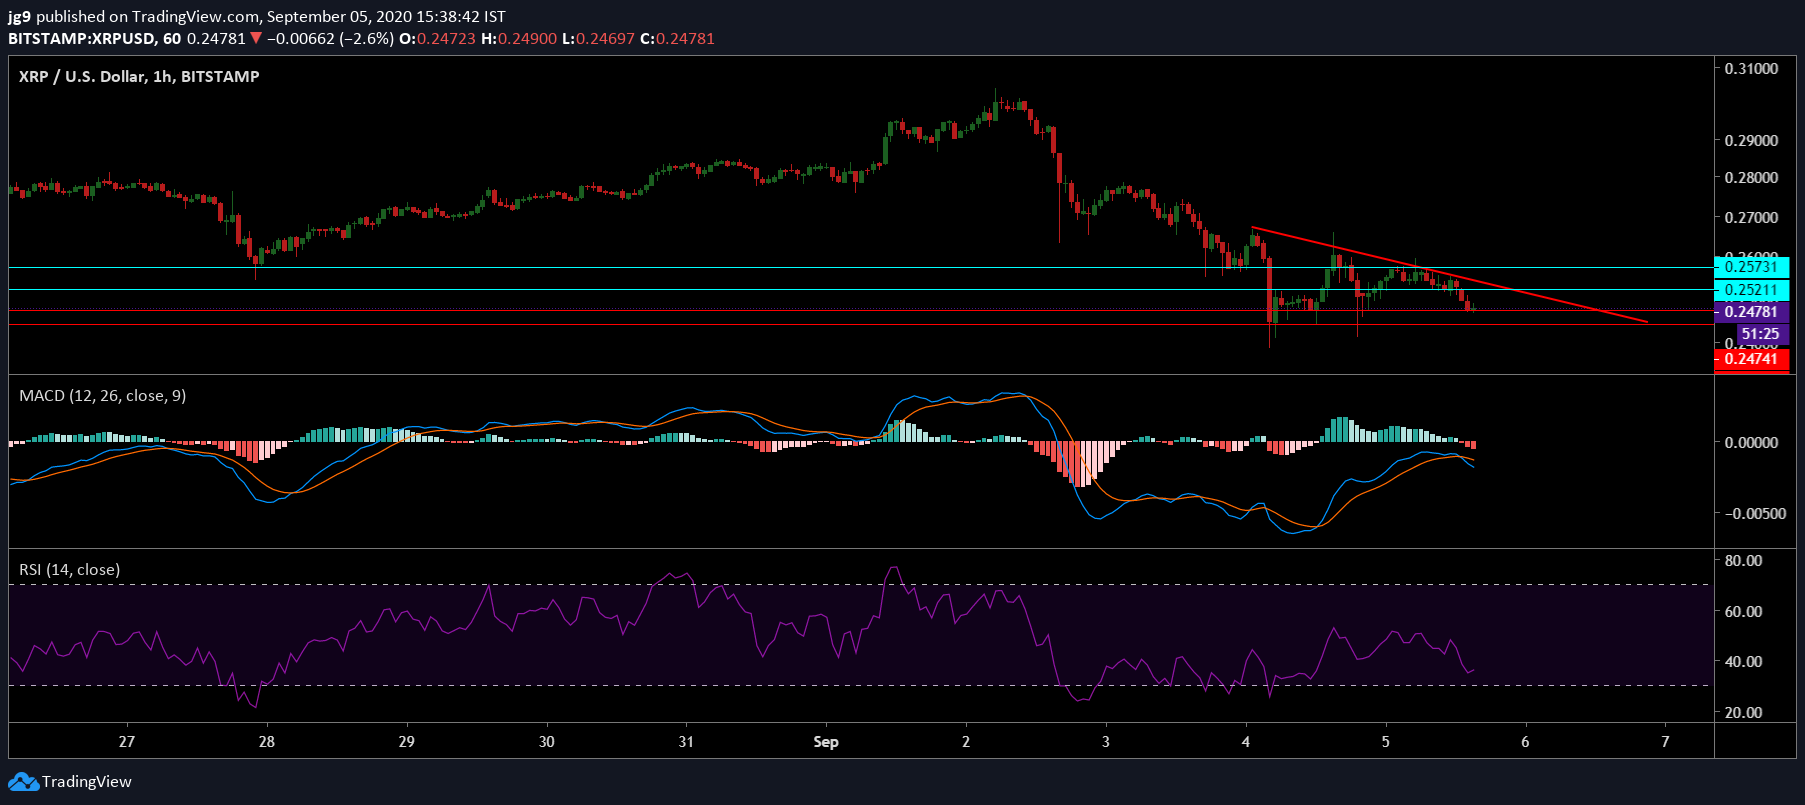
Source: XRP/USD, TradingView
In the short-term and within the 24-hour window, the price of XRP is likely to register a minor dip on the charts. At press time, the MACD indicator had undergone a bearish crossover, while signaling downward movement for the coin’s price. Further, the RSI continued to remain close to the oversold zone. However, a move towards the neutral zone could be on the cards for XRP’s RSI.


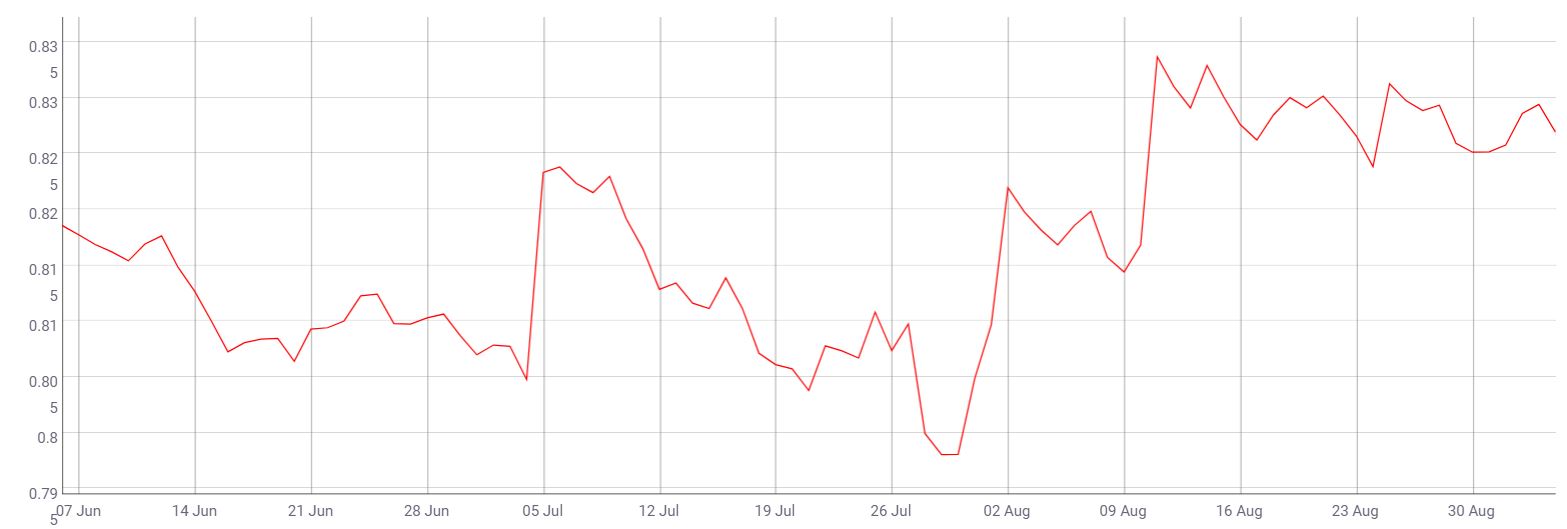
Source: CoinMetrics
XRP’s correlation with Bitcoin over the past 3 months has remained strong, despite some bouts of volatility here and there. The same was evident after XRP mirrored Bitcoin’s price movement over the past few days.
Conclusion
XRP’s price action on the charts over the past few days hasn’t been very inspiring and its downward movement is likely to sustain itself in the short-term before it rallies. In a day or two, however, the coin’s price is likely to dip further and move towards the second support level at $0.244. However, if the coin were to note bullish momentum, it may head towards its immediate support level and break out of the descending channel formation.
The post appeared first on AMBCrypto


